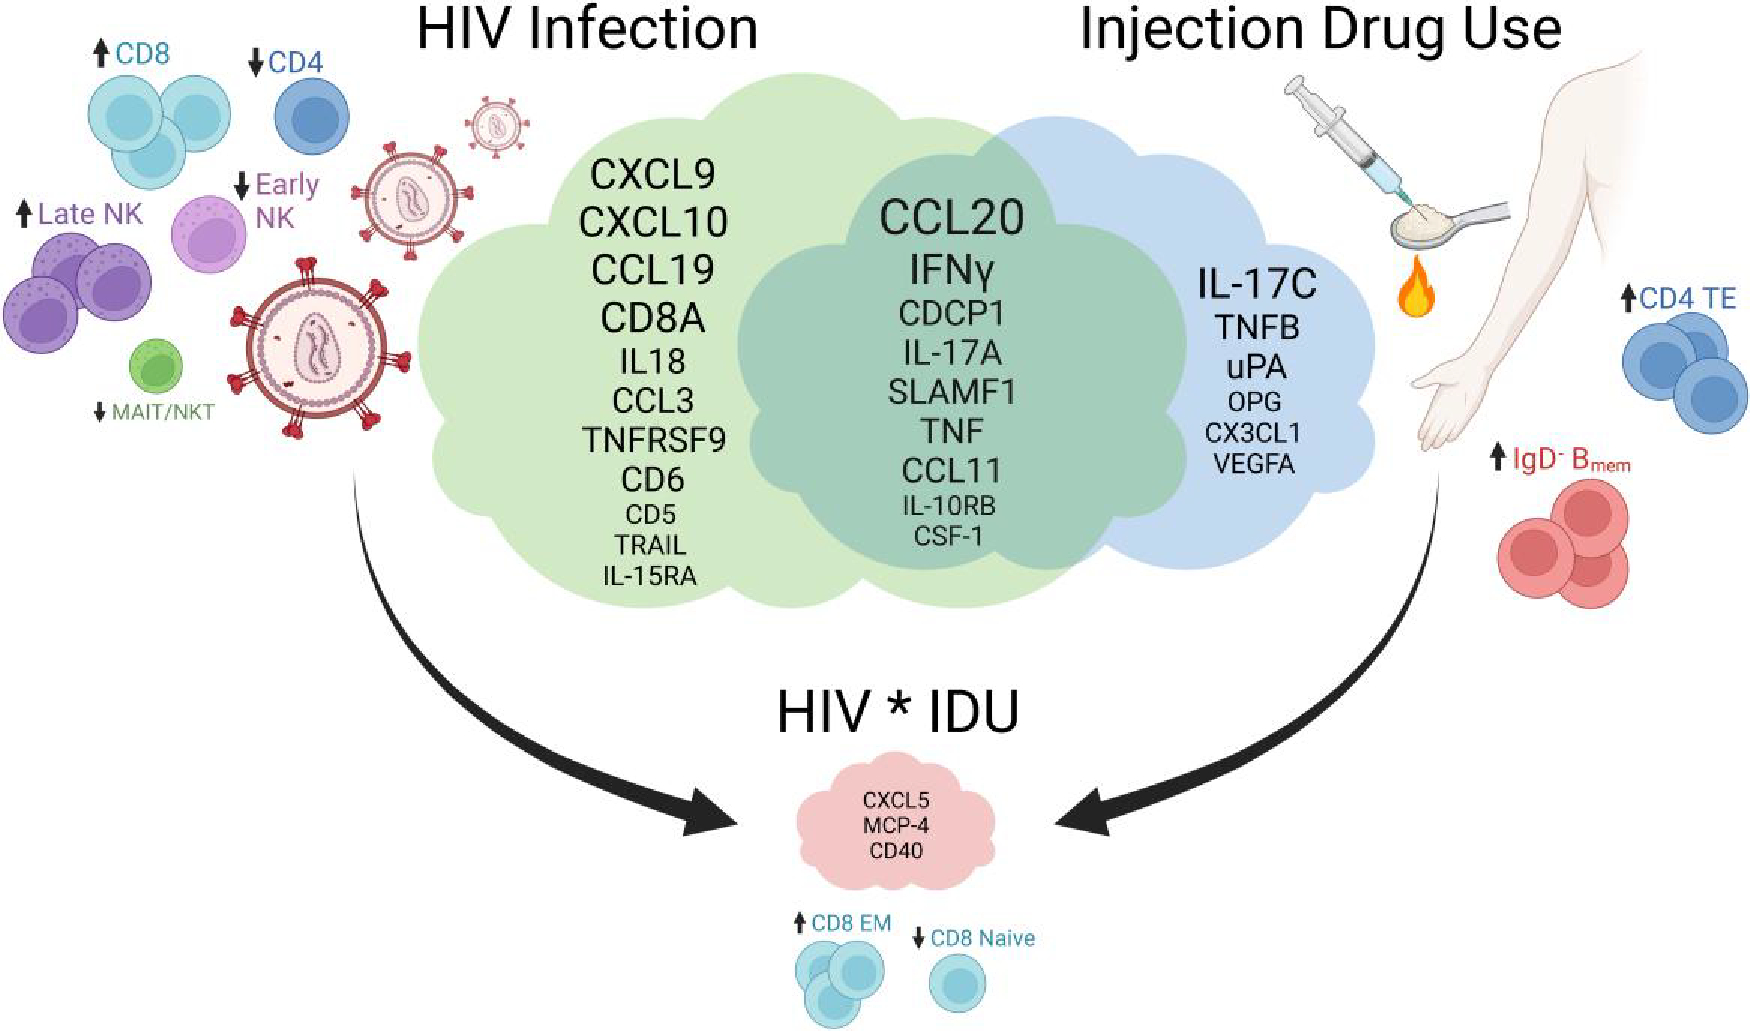
Fig. 5.

The effects of HIV infection and injection drug use on the peripheral immune repertoire. The upregulated cytokines are shown in the cloud Venn diagram for HIV infection, injection drug use, and those that are in common. The dysregulated immune cell populations are also displayed with arrows indicating an increasing effect (“up” arrow) or decreasing effect (“down” arrow). The upregulated cytokines and dysregulated cell populations with significant interaction effects (synergy) between HIV infection and injection drug use are shown. The smaller text size indicates a less significant effect, while the larger text size indicates a more significant effect. Created with BioRender.com.
