
FIGURE 3.
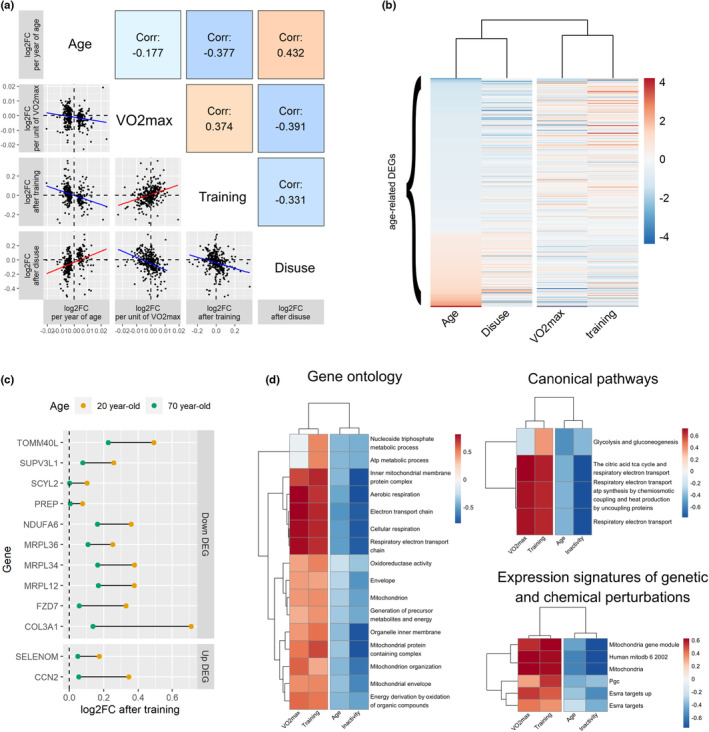
Aerobic fitness and exercise training show similar associations with muscle transcriptomic profiles and contrast with those seen with age and muscle disuse. (a) Pairwise correlation (Spearman) between the effect sizes of age, aerobic fitness (VO2max), exercise training, and muscle disuse at age‐related DEGs. Each dot corresponds to one of the 330 age‐related DEGs, and the axes represent the magnitude of effect for age, VO2max, exercise training, and disuse. (b) Unsupervised hierarchical clustering of the effect sizes of age, VO2max, exercise training, and disuse at age‐related DEGs (ordered from the most downregulated to most upregulated with age). Note that the legend is arbitrary as effect sizes were scaled to an SD of 1 for age, VO2max, exercise training, and disuse to be comparable. (c) Comparison of the magnitude of exercise‐induced changes in gene expression between a hypothetical 20‐ and 70‐year‐old. The genes displayed are those for which “age” was a significant moderator according to the meta‐regression conducted by Amar et al. (2021) “Down DEG” = gene whose expression decreases during normal aging; “Up DEG” = gene whose expression increases during normal aging. (d) Multi‐contrast enrichment comparing the effects of age, VO2max, exercise training, and muscle disuse at age‐related DEGs. Genes related to mitochondrial function showed clear indications of downregulation during aging and following muscle disuse while being simultaneously upregulated with higher VO2max and following exercise training. This was visible across the Gene Ontology, Canonical Pathways, and Expression Signature of Genetic and Chemical Perturbations gene sets.