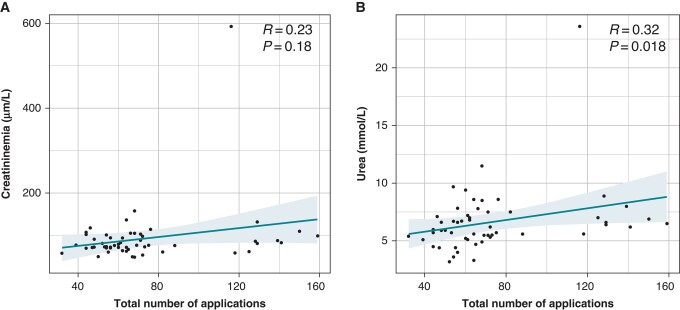
Figure 3.
Correlation between the total number of applications and the biological parameters of renal function. (A) Correlation between the total number of applications and the creatinine level after ablation (R = 0.23, P = 0.18). (B) Correlation between the total number of applications and the urea level after the procedure (R = 0.32, P = 0.018).

