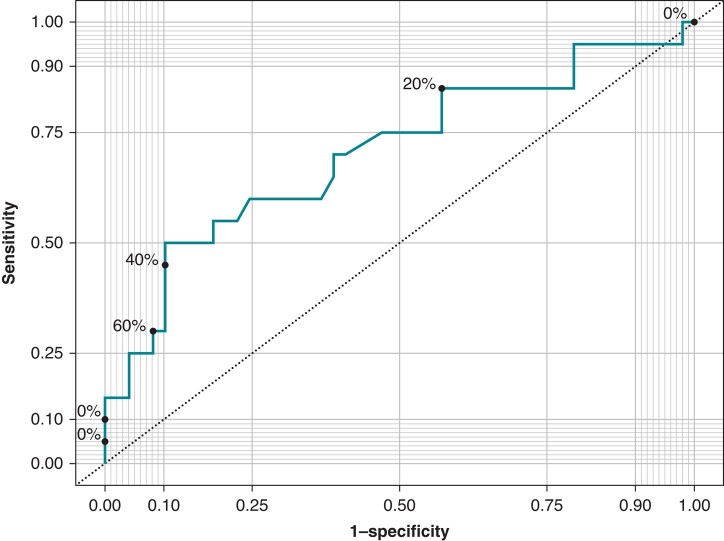
Figure 4.
Area under the curve (AUC), sensitivity, specificity, and optimal cut-off values for predicting a collapsed haptoglobin level (<0.04 g/L) on the first day after surgery by the number of applications. The ROC curve shows better sensitivity and specificity at around 70 applications (AUC: 0.709). ROC, receiver operating characteristic.

