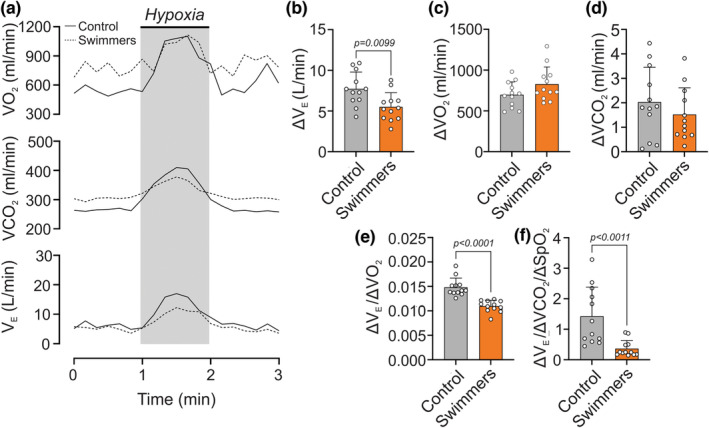
FIGURE 1.

Hypoxic ventilatory responses in young trained swimmers (HVR). (a) Representative minute ventilation (V E), oxygen uptake (VO2), and carbon dioxide production (VCO2) recording of one control and swimmer participant during a hypoxic challenge (pure N2). Note that swimmers displayed a decreased V E response compared to the control participants. (b) Quantification of ΔVE between normoxia and hypoxia in both groups. (c) Quantification of ΔVO2 between normoxia and hypoxia in both groups. (d) Quantification of ΔVCO2 between normoxia and hypoxia in both groups. (e, f) The swimmer's group showed a significantly lower HVR through ΔVE/ΔVO2 and ΔVE/ΔVCO2/ΔSpO2, compared to the controls. Unpaired t‐test for (b, c, e, and f); and Mann–Whitney test for (d). Values are mean SD; control, N = 12, and swimmers, n = 12.
