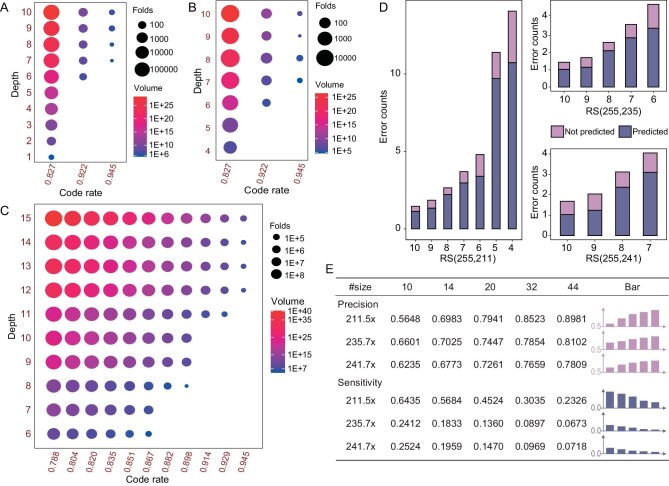
Figure 2.
Results of Derrick decoding algorithm and soft-decision strategy via in vitro and in silico experiments. (A) Improvement of Derrick compared with hard-decision decoding on in vitro ONT datasets. The horizontal and vertical axis represent the code rate and sequencing depth, respectively. The size of the circle represents the folds of improvement which is measured by the ratio of the probability of an uncorrectable error calculated using the soft-decision strategy versus that calculated using the hard-decision strategy. The color shading of the circle represents the achievable storage volumes of Derrick. (B) Improvement of Derrick compared with hard-decision decoding on in vitro Illumina datasets. The meanings of horizontal axis, vertical axis, size and color of the circle are all same as (A). (C) Improvement of the soft-decision strategy compared with the hard-decision one on PacBio CLR simulated datasets. The meanings of horizontal axis, vertical axis, size and color of the circle are all same as (A). (D) Error prediction performance of the soft-decision strategy on in vitro ONT datasets. The horizontal and vertical axis represent the sequencing depth and the number of errors, respectively. The color indicates the average number of successfully predicted errors (represented by the dark color) and the number of errors failed to predict (represented by the shallow color) for each block. (E) Comparison of the prediction performance of Derrick with different sizes of the prediction set, tested via in vitro ONT experiments. The bar plot of precision shows a tendency of improvement with the increasing size of the prediction set, with the y-axis starting from 0.5. Conversely, the bar plot of sensitivity shows a tendency of decrease with the increasing size of the prediction set, with the y-axis starting from 0. The ‘#size’ represents the size of the prediction set; ‘RS211.5× ’ represents RS (255, 211) and sequencing depth 5×; ‘RS235.7× ’ and ‘RS241.7× ’ represent similarly as ‘RS211.5× ’.

