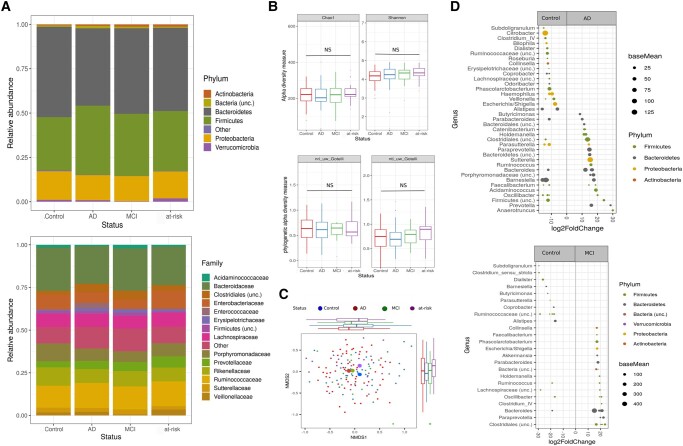
Fig. 1.
Alteration of fecal microbiota among groups. A) Stacked bar plots of average relative abundance at the phylum and family taxonomic levels. Top 6 phyla (representing 99.6% of all sequence reads) and top 14 families (representing 90.6% of all sequence reads) are shown. B) Alpha diversity measurements (Chao1 and Shannon index) as well as phylogenetic measurements (unweighted NRI and NTI) for patients with AD and MCI and at-risk group versus healthy controls (Chao1 AD = 211, Chao1 control = 215, Chao1 MCI = 219, Chao1 at-risk = 233; Shannon AD = 4.2, Shannon control = 4.1, Shannon MCI = 4.1, Shannon at-risk = 4.3). C) NMDS plot of Bray–Curtis dissimilarities (NMDS, stress value = 0.23) displays sample-wise differences in community composition between health conditions (coloration with respect to group membership, group centroids indicated by large symbols). Marginal boxplots display the grouped distribution of individuals/samples along the respective dimension of the NMDS plot analysis of relative sample ASV composition. D) Differential abundance analysis identified 33 ASVs that were increased and 43 ASVs that were decreased in AD relative to control participants (PFDR < 0.05) as well as 24 ASVs increased and 16 ASVs decreased in patients with MCI relative to control participants. Each point represents an ASV. ASVs to the right of the zero line are more abundant and ASVs to the left of the zero line are less abundant in AD and MCI compared with control groups. Abbreviations: MCI, mild cognitive impairment; AD, Alzheimer's disease.

