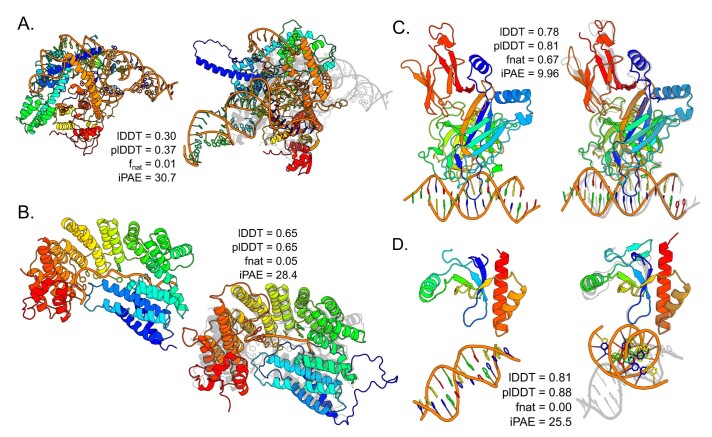
Extended Data Fig. 1. Failure modes of protein - nucleic acid structure prediction.
(a–d) Comparisons of representative predictions showing common failure modes of predictions in cases with no training-set homologs. Left is the deposited model, and right is the prediction. (A) Example where the individual subunits predict with poor accuracy, resulting in an incorrect overall complex (pdb ID: 6XMF). Cases like this represent 50% of the examined failures and often result from very large or very small single-stranded nucleic acids (>100 or <20 nucleotides), large multi-domain proteins, or heavily distorted duplex DNAs. (B) Example where the subunits predict with reasonable accuracy and the relative orientation is correct but the details of the interface are wrong (pdb ID: 7A9X). Cases like this represent 20% of the examined failures, and can also result from small single-stranded nucleic acids or slight deviations in monomer structures. (C) Example where the subunits predict with high accuracy and the backbone-backbone binding mode is correct, but the interface is predicted at the wrong site on the DNA (pdb ID: 4J2X). Cases like this represent 10% of the examined failures. (D) Example where both subunits predict correctly but the relative orientation and interface are incorrect (pdb ID: 7LH9). Cases like this represent 20% of the examined failures, and can result from distorted or non-duplex DNA structures or slight deviations in monomer structures.

