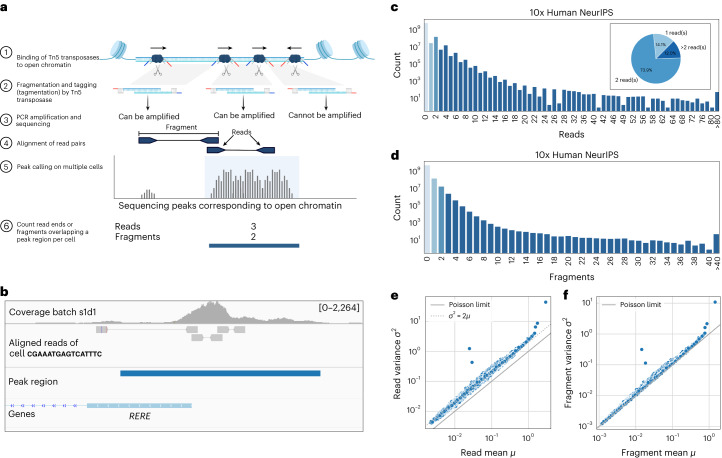
Fig. 1. scATAC-seq data are quantitative and fragments, rather than reads, should be counted.
a, Illustrated is the scATAC-seq protocol and count aggregation strategy. Tn5 transposases insert into open chromatin regions, cut the DNA and attach sequencing adaptors (blue and red). Two Tn5 insertions create one fragment with adaptors. The orientation of the insertion is important as only fragments flanked with two distinct barcodes can be captured and amplified. Fragments are sequenced paired-end and aligned to the genome. scATAC-seq peak calling is performed using reads from multiple cells. Once peak regions are identified, reads (deduplicated fragment ends) or fragments overlapping the peak region are counted for each cell separately. b, Genome viewer snapshot of one peak region in the NeurIPS dataset at the promoter of the human gene RERE showing multiple insertions in a single cell. The tracks show, from top to bottom, the coverage of one batch used for peak calling, the aligned read pairs of a single cell, the peak region and genome annotation. The peak region overlaps with five reads and three fragments. c, Read count distribution on the entire NeurIPS dataset. The striking odd/even pattern in read count distribution reflects that reads come in pairs and suggests that fragment counts, rather than reads, should be modeled. Pie chart showing the percentage of all non-zero peaks with one, two or more than two reads (inset). d, Distribution of the approximated fragment count does not show an even/odd pattern. e, Variance of read counts across cells against mean read counts. Each dot represents one peak region. When fragment ends (reads) are counted, the variance of read counts is about twice the mean (gray dotted line), which is not consistent with a Poisson distribution (solid gray line). f, Same as e, but for fragment counts. The variance of fragment counts is approximately equal to the fragment count mean, consistent with a Poisson distribution (solid gray line).

