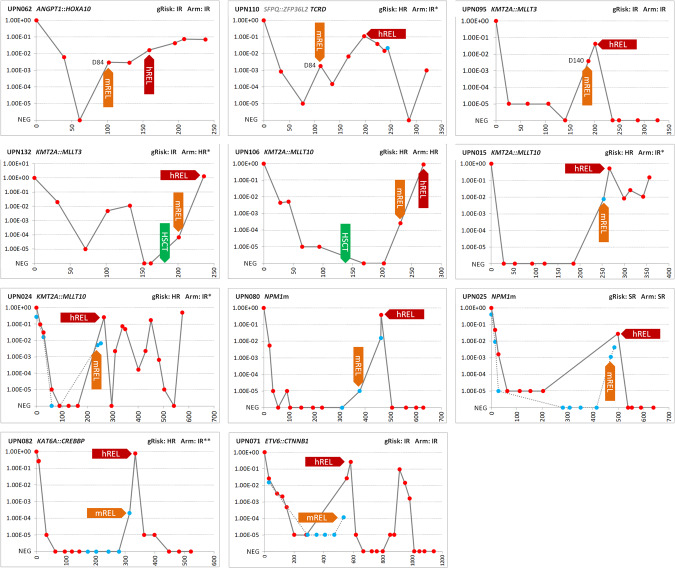
Fig. 2. Detection of molecular relapse.
The figure shows the course of MRD in 11 patients with detected molecular relapse. The unique numbers and primary aberrations of the patients are shown in the headers of the graphs. Primary aberrations were used as MRD targets in 10 patients, while the TCRD gene rearrangement was used as a target in patient UPN110. Three patients who relapsed while still on treatment are shown in the top row. Red circles correspond to BM samples, blue circles to PB samples. The Y-axis shows MRD levels, for graphical representation, non-quantifiable positive samples were assigned an MRD value of 1.00E−05. X-axis shows time since diagnosis (time 0) in days. gRisk, (cyto)genetic risk (see Supplementary Fig. 1 for risk stratification); Arm, treatment arm of AML-BFM 2012 registry protocol; *patients were treated in a different treatment arm than would correspond to gRISK based on clinicians’ decision; **gRISK was assigned retrospectively based on the corrected cytogenetic result reporting a complex karyotype, treatment followed the originally assigned IR gRISK; mREL molecular relapse, hREL hematological relapse, NEG negative, D day. None of the patients had WT1m; FLT3-ITD was present only in patient UPN080, who was enrolled in CPKC412A2218 trial and received FLT3-inhibitor.

