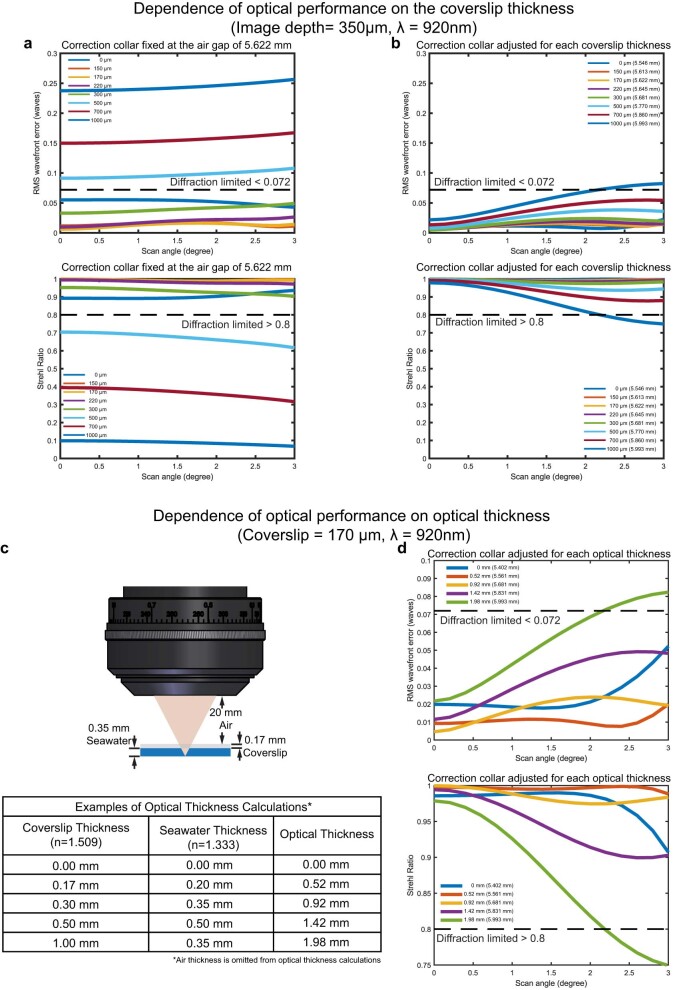
Extended Data Fig. 7. Dependence of performance on coverslips of different thickness and the compensation using the correction collar.
The root-mean-squared (RMS) wavefront error (top) and the Strehl ratio (bottom) as a function of the scan angle at the back aperture and coverslips of different thickness are shown with the correction collar fixed at an air gap of 5.622 mm in (a), and with the correction collar optimized for coverslips of different thickness in (b). The thickness of coverslips ranging from 0-1000 µm are color coded. (c) The schematic shows the Cousa objective focuses light through a 0.17 mm thick coverslip and 0.35 mm of seawater. The optical thickness of the non-air elements between the objective and the focal plane can be calculated: multiply the thickness of a material (ignoring air) in millimeters by its refractive index, and sum over all of these products. For example, the optical thickness shown in the schematic is 0.723 (0.17 mm × 1.509 + 0.35 mm × 1.333). The table below shows combinations of the coverslip thickness and the seawater thickness, and the resultant optical thickness for each combination. The correction collar can be adjusted to compensate for the optical thickness over the range of 0 - 2 mm, and maintain the diffraction-limited performance. (d) The root-mean-squared (RMS) wavefront error (top) and the Strehl ratio (bottom) as a function of the scan angle at the back aperture are shown when the correction collar is optimized for different optical thickness of non-air materials. Each curve is color coded for different optical thickness shown as the number before the parenthesis. The number in the parenthesis is the optimal thickness of air gap to achieve the best optical performance.

