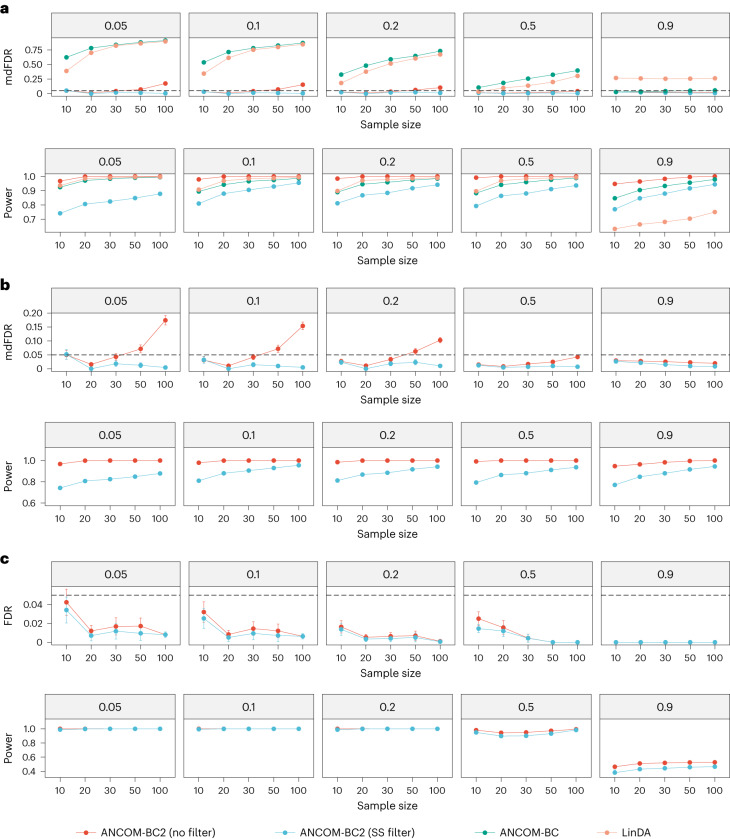
Fig. 2. FDR (mdFDR) and power comparisons for multiple exposure groups.
a–c, The FDR (mdFDR) and power of various DA methods for multiple pairwise comparisons against a reference group (a), multiple pairwise comparisons (b) and pattern analysis (c) are summarized. Synthetic datasets were generated using the PLN model18 based on the mean vector and covariance matrix estimated from the URT dataset19. The x axis represents the sample size per group, and the y axis shows the FDR (mdFDR) or power. The dashed lines denote the nominal level of FDR (FDR = 0.05) or mdFDR (mdFDR = 0.05). The proportion of true DA taxa are provided in the top of each panel. The mean estimated FDR (or power) ± standard errors (indicated by error bars) derived from 100 simulation runs are provided in each panel. Within the context of multiple pairwise comparisons, ANCOM-BC2 (SS filter) effectively controlled FDR (mdFDR) while maintaining power similar to ANCOM-BC2 (no filter).

