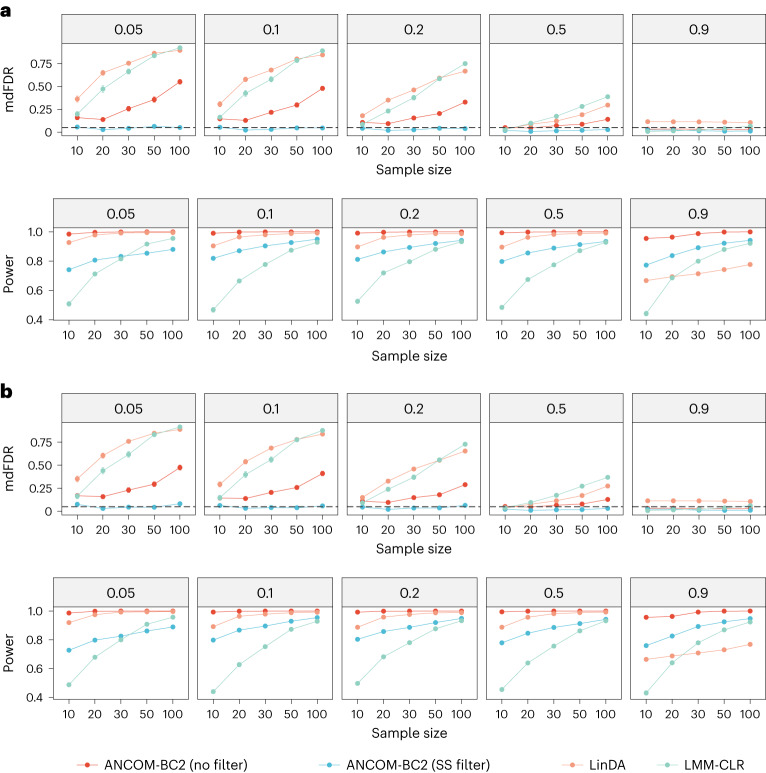
Fig. 3. mdFDR and power comparisons for correlated samples.
a,b, The mdFDR and power of various DA methods in a random intercept model (a) and a random coefficients model (b) are summarized. Synthetic datasets were generated using the PLN model18 based on the mean and covariance estimated from the URT dataset19. The x axis represents the sample size per group, and the y axis shows the mdFDR or power. The dashed lines denote the nominal level of FDR (FDR = 0.05) or mdFDR (mdFDR = 0.05). The proportion of true DA taxa are provided in the top of each panel. The mean estimated mdFDR (or power) ± standard errors (indicated by error bars) derived from 100 simulation runs are provided in each panel.

