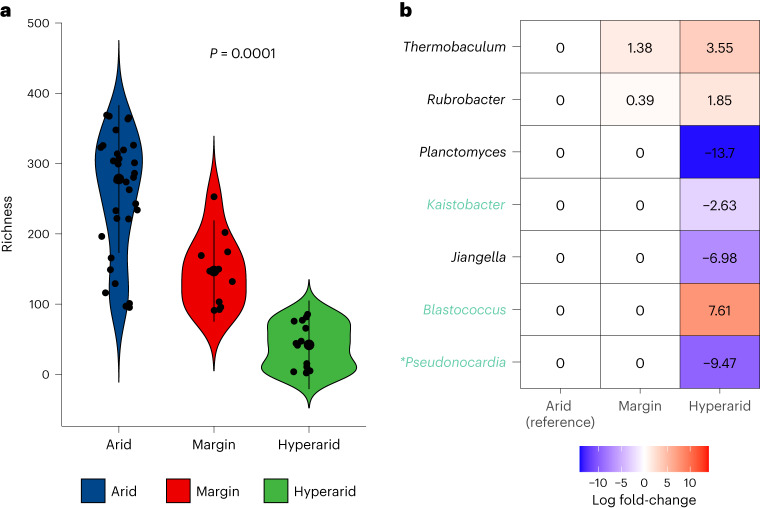
Fig. 4. DA analysis of desert soil microbial genera with increasing aridity.
a, Violin plot illustrating the relationship between aridity and microbial richness. Samples encompass 63 biologically independent pits obtained from 18 distinct Atacama Desert sites in Chile24. Each violin’s median value is signified by a central black dot, while the interquartile range is represented by a black bar. The violin’s width mirrors the density of data points at each richness value. Individual data points are also displayed as jittered dots. A trend test using the constrained inference-based approach7 suggests a significant decline in richness with increase in soil aridity (P = 0.0001). b, ANCOM-BC2 (no filter) pattern analysis heatmap in relation to aridity. Monotonically increasing and decreasing trends were evaluated across ordered soil categories, with arid soil as the reference. The columns denote soil categories and the significant genera identified by ANCOM-BC2 pattern analysis are provided in the rows. Each cell color represents abundance change: blue indicates reduction and red signifies increase. The log fold-changes relative to the reference group (arid group) are noted in each cell. The Holm–Bonferroni method was used for multiple testing correction. Genera represented in black are significant without a multiple testing correction, whereas those highlighted in green are significant after multiple testing correction. Additionally, genera marked with an asterisk are also significant after applying the ANCOM-BC2 (SS filter).

