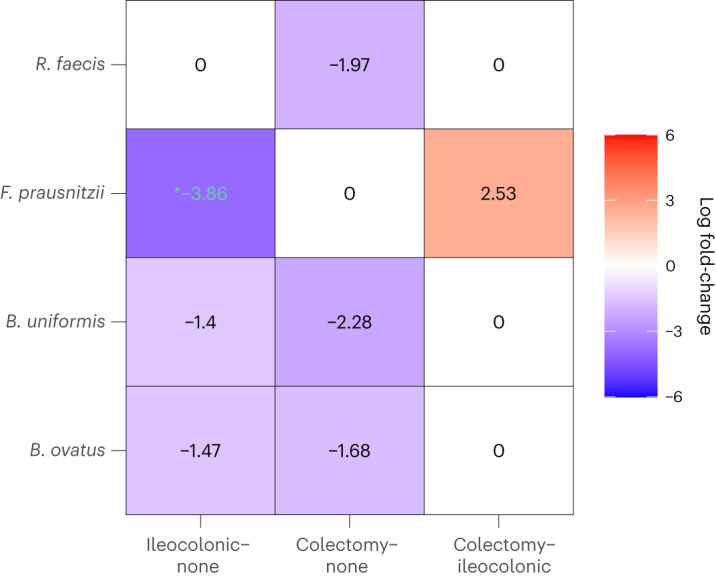
Fig. 5. Heatmap of ANCOM-BC2 (no filter) pairwise analysis evaluating the impact of surgical resection on microbial species.

In a cohort of patients with IBD35, the analysis entailed multiple pairwise comparisons among three distinct groups: ileocolonic resection, colectomy and no intestinal surgery, while maintaining an overall mdFDR at 0.05. The columns denote the specific comparisons: ileocolonic resection versus no intestinal surgery, colectomy versus no intestinal surgery and ileocolonic resection versus colectomy. The rows list significant species as identified by ANCOM-BC2. Each cell is color-coded to represent significant changes in absolute abundance: blue represents reduced abundance and red indicates increased abundance. Multiple testing corrections were performed using the Holm–Bonferroni method. The text within each cell represents the log fold-change value. The log fold-change values displayed in black represent significant changes without adjustment for mdFDR, whereas those in green are significant after applying mdFDR control. Furthermore, values with an asterisk are significant following the application of the ANCOM-BC2 (SS filter).
