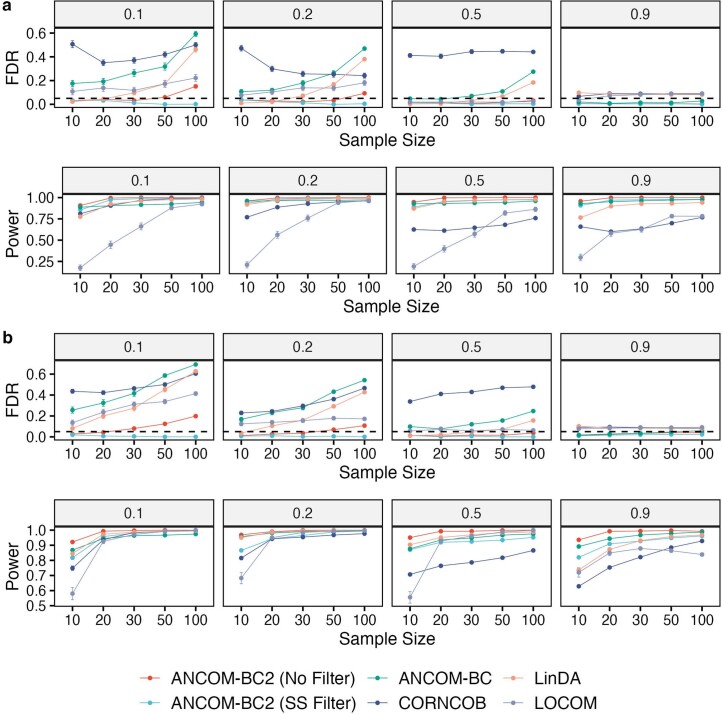
Extended Data Fig. 3. Evaluations of FDR (mdFDR) and power in identifying DA taxa in (a) continuous or (b) binary exposure.
Synthetic datasets were generated using the PLN model18 based on the mean and covariance estimated from the QMP dataset23. The X-axis shows the sample size (or sample size per group for the categorical covariate), and the Y-axis shows the FDR (mdFDR) or power. Each panel title designates the proportion of true DA taxa. The depicted metrics represent mean values ± standard errors (indicated by error bars) derived from 100 simulation runs for each setting. This visualization underscores the superiority of ANCOM-BC2-both with and without the sensitivity score (SS) filter-in consistently preserving minimal FDR or mdFDR while attaining satisfactory power, outpacing all other assessed methods.

