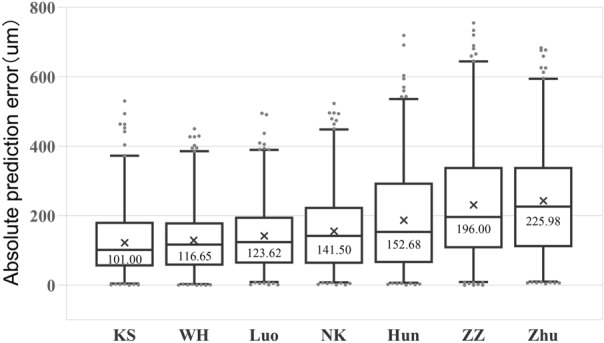
Fig. 1.

Distribution of the absolute prediction error. Formulae are ranked according to the median absolute prediction error, increasing from left to right. In the post hoc comparisons of absolute prediction error between formulae, all comparisons were statistically significant (P < 0.001), except for the differences between the WH and KS formulae, the Zhu and ZZ formulae, and the Luo and NK formulae, which were not statistically significant (P > 0.05)
