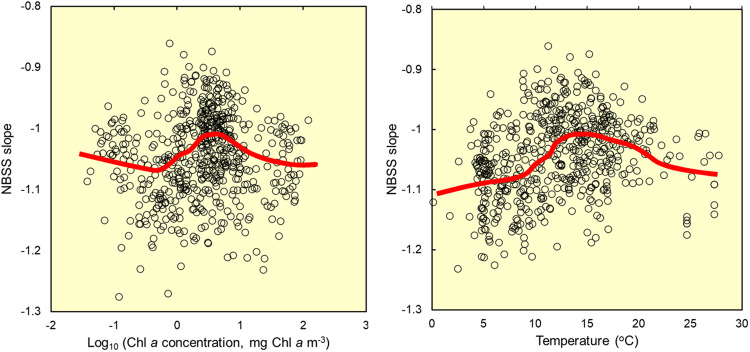
Fig. 3. At the smaller scales of seasonally-resolving “snapshots” of size spectra, the NBSS slope shows varied relationships, reflecting system-specific bloom dynamics.
Data from 591 high resolution determinations of NBSS (Normalised Biomass Size Spectrum) slope. NBSS slopes are plotted in relation to parallel, simultaneous observations of surface Chl a and water temperature, typically pertaining to a single visit to a single station. These data were taken, where available, from the 40 high-quality size spectrum studies presented in Fig. 2. LOWESS lines show underlying trends. Supplementary Fig. 2 contains individual plots for three of the component ecosystems which were particularly intensely studied. Source data are provided as a Source Data file.

