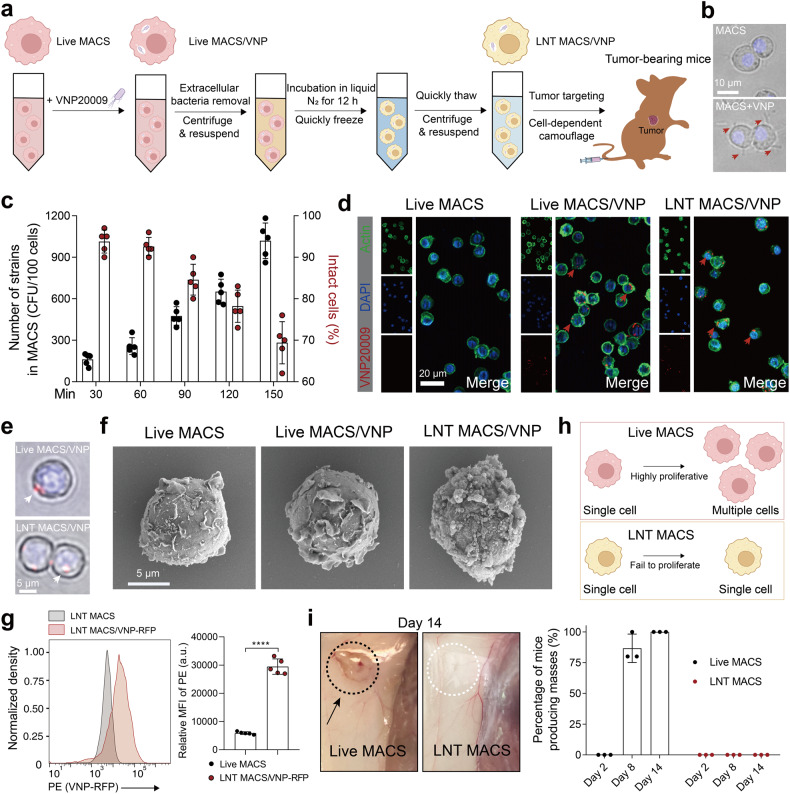
Fig. 1.
Preparation and characterization of cryo-shocked macrophages loaded with VNP strains. a Schematic diagram of the LNT MACS/VNP cell preparation process. b Bright-field pictures of macrophages (MACS) cocultured with VNP strains (MACS + VNP). Hoechst marks nuclei (blue). Red arrows indicate the VNP strains. Scale bar = 10 μm. c Changes in the number of live VNP strains loaded intracellularly in MACS and the percentage of morphologically intact MACS over the time the cells were cocultured with the strain (n = 5). d Fluorescence images of Live MACS, Live MACS/VNP cells and LNT MACS/VNP cells. FITC-phalloidin marks actin (green); DAPI marks nuclei (blue). Red arrows indicate the intracellular VNP-RFP strains. Scale bar = 20 μm. e Bright-field pictures of Live MACS/VNP and LNT MACS/VNP cells. Hoechst marks nuclei (blue). White arrows indicate the VNP strains (strain expressing red fluorescent protein). Scale bar = 5 μm. f Scanning electron microscopy (SEM) was used to observe the morphology of different cells. Scale bar = 5 μm. g Relative mean fluorescence intensity (MFI) of LNT MACS and LNT MACS/VNP-RFP is represented. a.u., arbitrary unit. h Schematic of the proliferative activity comparison of Live MACS and LNT MACS. i Comparison of the in vivo proliferative activity of Live MACS and LNT MACS (right). Percentage values are summarized from three independent experiments (n = 5 mice per group per independent experiment). Representative anatomically observed images of mass generation are shown (left). The area inside the dotted ellipse represents the site of inoculation. The data are reported as the mean ± SD. All data are representative of two independent experiments. **** p < 0.0001

