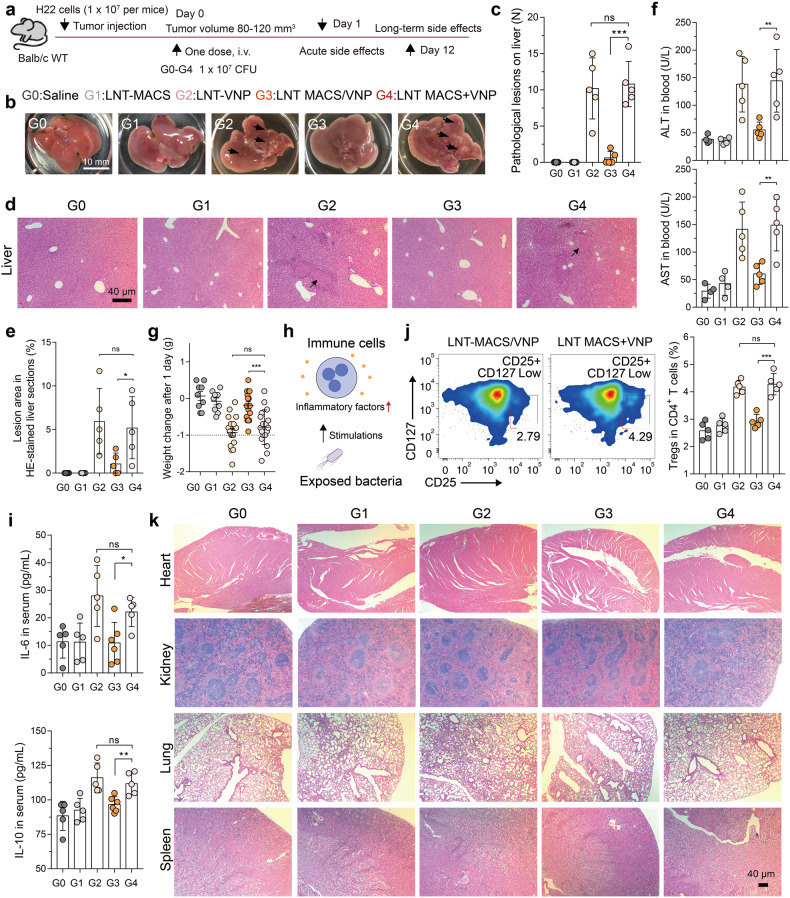
Fig. 4.
LNT MACS/VNP reduces strain-induced biotoxicity. a Schematic diagram of the safety assessment, tumor targeting and therapy assay of different groups (G0-G4) on H22 tumor-bearing mice. b Representative pictures of hepatic inflammatory lesions in each group of mice 1 day after administration. Black arrows indicate the site of pathological liver lesions. Scale bar = 10 mm. c Bar graph comparing the number of hepatic inflammatory lesion points in each group in (b) (n = 5). d Close-up view of representative H&E staining showing liver injury (black arrow) 1 day after treatment. Scale bar = 40 µm. e Five visual fields in (d) were randomly selected to count the area of the lesion. f Serum alanine transaminase (ALT) and aspartate transaminase (AST) levels 1 day after different treatments (n = 4 or 5). g Changes in body weight 1 day after different treatments (n = 9 or 18). h Schematic diagram of bacterial stimulation of immune cells to produce inflammatory factors. i Detection of IL-6 (top) and IL-10 (bottom) concentrations in the peripheral blood of H22 tumor-bearing mice 1 day after different treatments (n = 5 or 6). j Change in the percentage of Tregs (CD25+ CD127Low cells) among CD4+ T cells from the peripheral blood 1 day after different treatments. A representative flow cytometric plot is shown (n = 5). k Close-up view of representative H&E staining of heart, kidney, lung and spleen sections (scale bar = 40 µm). The data are reported as the mean ± SD. All data are representative of two independent experiments. * p < 0.05; ** p < 0.01; *** p < 0.001; **** p < 0.0001; n.s. not significant

