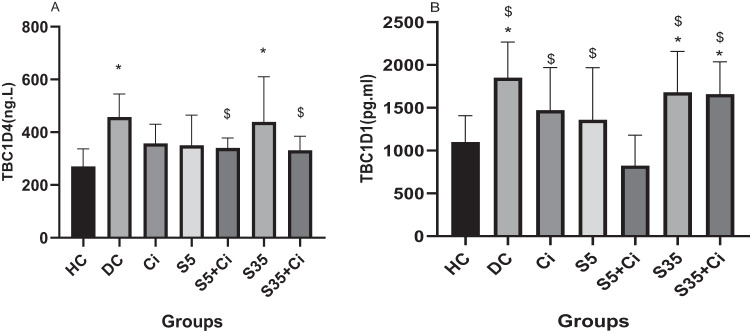
Fig. 1. TBC1D4 and TBC1D1 levels in different groups.
TBC1D4 level (A) and TBC1D1 level (B). Bars and whiskers represent the mean and SD, respectively. Significantly higher levels of TBC1D4 in DC and S35 groups (A). Significantly higher levels of TBC1D1 in DC, S35, and S35+Ci groups (B). Asterisk (*) indicates a significant difference compared to the HC group. The symbol $ indicates a significant difference compared to the S5+Ci group.

