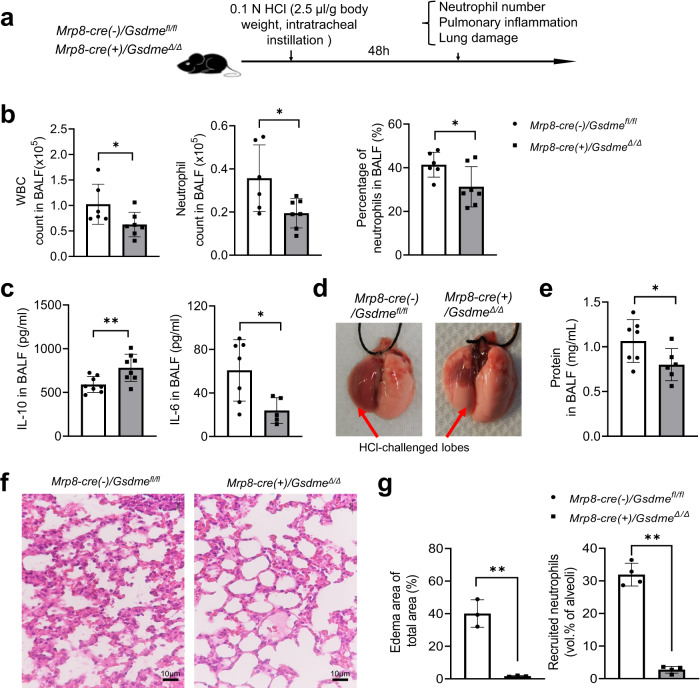
Fig. 10. Neutrophil-specific GSDME deletion attenuated inflammation and alleviated lung injury in acid aspiration pneumonitis.
a Experimental scheme for assessing acid-induced pulmonary inflammation and associated lung injury in WT (Mrp8-cre(-)/Gsdmefl/fl) and neutrophil-specific Gsdme KO (Mrp8-cre(+)/GsdmeΔ/Δ) mice. Mice were challenged with 0.1 N HCl (2.5 μl/g body weight) and sacrificed after 48 h. b The number and percentage of neutrophils in BALF. WBC and neutrophil counts were determined by FACS using counting beads as described in Fig. S3. Cells were stained with APC-CD11b and PE-Ly6g antibodies. Neutrophils were identified as Ly6g+CD11b+ cells. All data are represented as mean ± SD, n = 6–7 mice, *P < 0.05 by two-sided Student’s t-test (WBC count, P = 0.0469; Neutrophil count, P = 0.0283; Percentage of neutrophils, P = 0.0407). c IL-10 and IL-6 levels in BALF of WT and neutrophil-specific Gsdme KO mice were determined by enzyme-linked immunosorbent assay (ELISA). All data are represented as mean ± SD, n = 7−8 mice, *P < 0.05, **P < 0.01 by two-sided Student’s t-test (IL-10, P = 0.0099; IL-6, P = 0.0213). d Representative images of the lungs of acid-challenged WT and neutrophil-specific Gsdme KO mice. The lung lobes challenged with HCl are indicated. Results are representative of at least three biological replicates. e BALF total protein level. Protein accumulation in inflamed lungs was measured using a protein assay kit. All data are represented as mean ± SD, n = 6–7 mice, *P < 0.05 by two-sided Student’s t-test (P = 0.0478). f Representative H&E-stained images of acid-challenged lung tissues. Results are representative of at least three biological replicates. g Neutrophil accumulation in alveoli was quantified as volume fraction of the alveolar space occupied by neutrophils. Pulmonary edema formation was quantified as the percentage of edema area in the total parenchymal region. Data are represented as mean ± SD of three experiments. n ≥ 6 mice in each group. **P < 0.01 by two-sided Student’s t-test (Edema area of total area, P = 0.0014; Recruited neutrophils, P = 0.0001). Source data are provided as a Source Data file.

