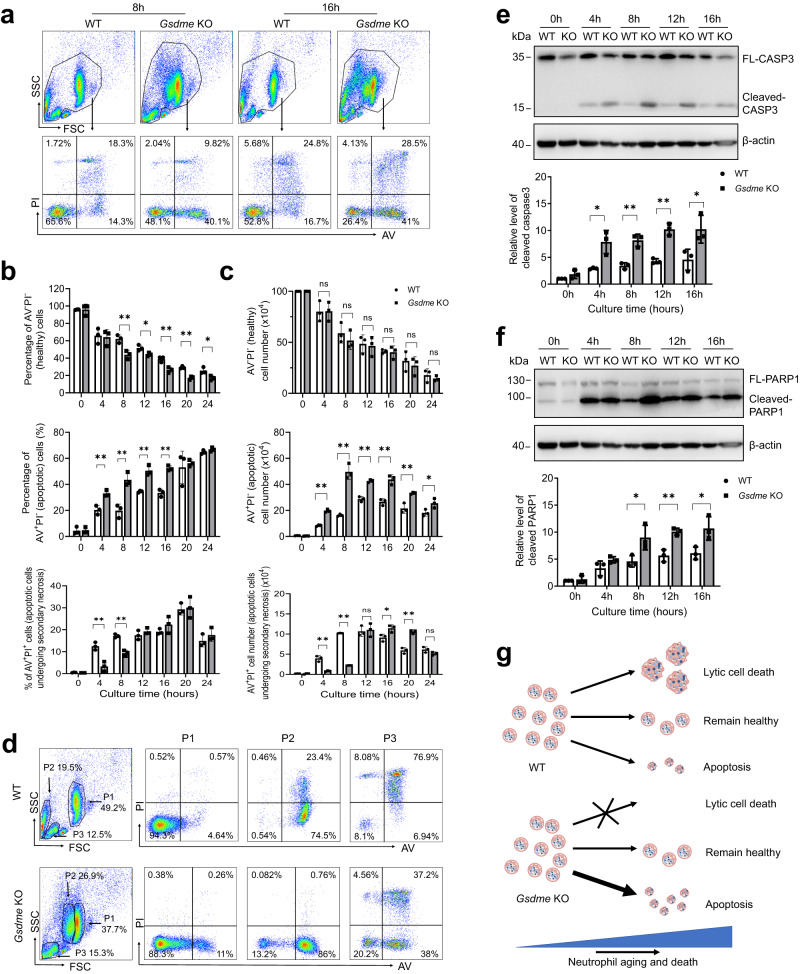
Fig. 2. GSDME disruption skewed programmed neutrophil death to apoptosis.
a Representative flow cytometry plots of neutrophils undergoing spontaneous cell death. Results are representative of at least three biological replicates. b The percentage of AV−PI−, AV+PI−, and AV+PI+ cells at the indicated time points. All data are represented as mean ± SD. n = 3 independent repeats, *P < 0.05, **P < 0.01, ns non-significant by unpaired two-sided Student’s t test (Percentage of AV−PI−cells: 8 h, P = 0.0082; 12 h, P = 0.0279; 16 h, P = 0.0083; 20 h, P = 0.001; 24 h, P = 0.0288. Percentage of AV+PI− cells: 4 h, P = 0.0064; 8 h, P = 0.0049; 12 h, P = 0.0022; 16 h, P = 0.0007. Percentage of AV+PI+ cells: 4 h, P = 0.0048; 8 h, P = 0.001). c The number of AV−PI−, AV+PI−, and AV+PI+ cells at the indicated time points. All data are represented as mean ± SD. n = 3 independent repeats, *P < 0.05, **P < 0.01, ns non-significant by unpaired two-sided Student’s t test (Number of AV+PI− cells: 4 h, P = 0.0001; 8 h, P = 0.0006; 12 h, P = 0.0004; 16 h, P = 0.0024; 20 h, P = 0.0059; 24 h, P = 0.0455. Number of AV+PI+ cells: 4 h, P = 0.0017; 8 h, P = 0.0001; 16 h, P = 0.0335; 20 h, P = 0.0008). d Representative scatter plots and AV/PI staining of different populations on scatter plots of WT and Gsdme KO neutrophils cultured for 8 h. Results are representative of at least three biological replicates. e Caspase-3 cleavage during neutrophil spontaneous death. Western blot results are representative of at least three independent experiments. Relative amounts of cleaved caspase-3 were quantified based on densitometry analysis using NIH ImageJ software. Results are the means (±SD) of three independent experiments. *P < 0.05, **P < 0.01 versus WT neutrophils by two-sided Student’s -test (4 h, P = 0.0168; 8 h, P = 0.0032; 12 h, P = 0.0010; 16 h, P = 0.039). f Cleavage of PARP1 during neutrophil spontaneous death. Western blot results are representative of at least three independent experiments. Relative amounts of cleaved PARP1 were quantified based on densitometry. Results are the means (±SD) of three independent experiments. *P < 0.05, **P < 0.01 versus WT neutrophils by two-sided Student’s t-test (8 h, P = 0.386; 12 h, P = 0.004; 16 h, P = 0.0319). g Summary of the mode of programmed spontaneous death of WT and Gsdme KO neutrophils. Source data are provided as a Source Data file.

