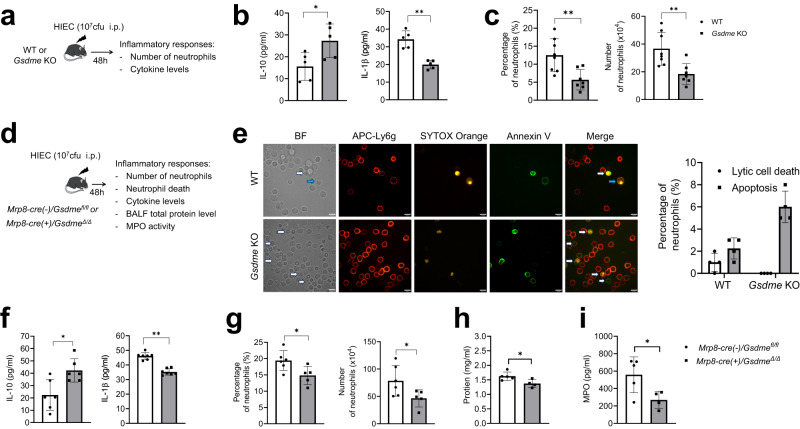
Fig. 5. Genetic ablation of neutrophil GSDME suppressed inflammatory responses in peritonitis.
a Schematic showing the experimental design for assessing inflammatory responses of WT and Gsdme whole-body KO mice during peritonitis. b IL-10 and IL-1β levels in the peritoneal lavage fluid. All data are represented as mean ± SD, n = 5 mice, *P < 0.05, **P < 0.01 (IL-10, P = 0.030; IL-1β, P = 0.0004). c Neutrophil percentage and number in the peritoneal cavity. All data are represented as mean ± SD, n = 7–8 mice, **P < 0.01 (Percentage of neutrophils, P = 0.0048; Number of neutrophils, P = 0.004). d Schematic showing the experimental design for assessing inflammatory responses of WT (Mrp8-cre(-)/Gsdmefl/fl) and neutrophil-specific conditional Gsdme KO (Mrp8-cre(+)/GsdmeΔ/Δ) mice during peritonitis. e In vivo neutrophil death. Lavage fluid from the peritoneal cavity was directly stained with APC-Ly6g to label neutrophils, and with Annexin V (AV) and SYTOX Orange to mark dead cells, all without centrifugation. The cells were subsequently fixed and immediately photographed. The images are representative of at least three independent experiments. Blue arrowheads indicate lytic dead neutrophils and white arrowheads indicate apoptotic neutrophils. The scale bar represents 10 μm. Data are presented as the mean ± SD, n = 3–4 independent repeats. f IL-10 and IL-1β levels in the peritoneal lavage fluid. All data are represented as mean ± SD, n = 6 mice, *P < 0.05, **P < 0.01 (IL-10, P = 0.0108; IL-1β, P = 0.0001). g Percentage and number of neutrophils in the peritoneal cavity. All data are represented as mean ± SD, n = 5–6 mice, *P < 0.05 (Percentage of neutrophils, P = 0.0299; Number of neutrophils, P = 0.0452). h Total protein level in the peritoneal lavage fluid. All data are represented as mean ± SD, n = 4–5 mice, *P < 0.05 (P = 0.0308). i MPO level in the peritoneal lavage fluid. All data are represented as mean ± SD, n = 4–5 mice, *P < 0.05 (P = 0.0368). Statistical significance was examined by unpaired two-sided Student’s t test (b, c, e, f, h, I, l, m, n, o). Source data are provided as a Source Data file.

