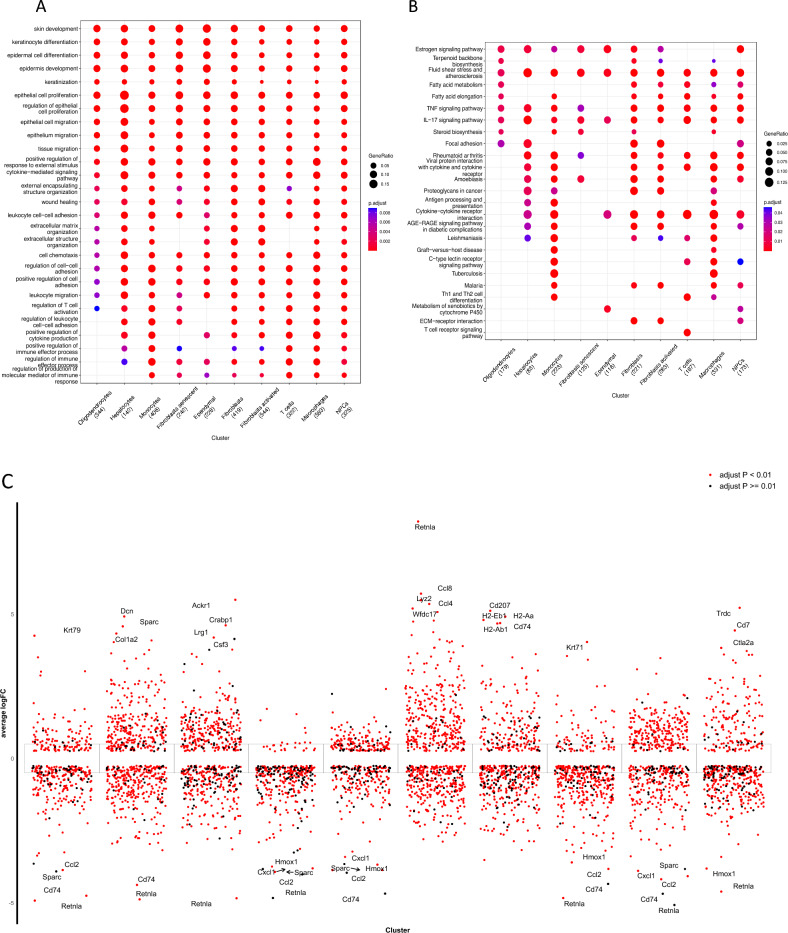
Figure 2.
Functional enrichment analysis of each Cell Types in skin UVB irradiation. (A) GO terms of each cluster of DGEs in UVB-irradiated skin cells. (B) Bubble map of the KEGG enrichment analysis of each cluster of DEGs in UVB-irradiated skin cells. The X-axis displays the various cell types while the Y-axis displays the various classifications. The size of the circle corresponds to the total amount of enriched genes within a subset. Different qualities are represented by each circle hue. (C) Analysis of difference in gene expression exposed to UVB showed up- and down-regulated genes in all 10 clusters. An adjusted p value < 0.01 is indicated in red, while an adjusted p value > = 0.01 is indicated in black.

