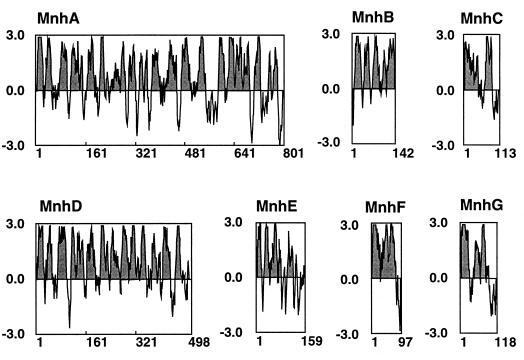
FIG. 4.
Hydropathy patterns of deduced Mnh proteins. Hydropathy values were calculated by the method of Kyte and Doolittle (28) for the deduced amino acid sequences of MnhA to MnhG. The values were plotted from the NH2 terminus to the COOH terminus. The portions above and below the midpoint line indicate hydrophobic and hydrophilic regions, respectively. The hydrophobic regions are shaded.

