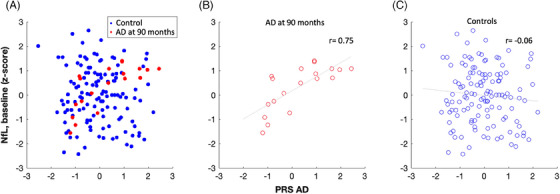
FIGURE 3.

Correlation of NfL at baseline with PRS‐CS in the AD at 90 months and the control group. The association of NfL at baseline (z‐scores) and PRS‐CS (z‐scores) is depicted for all participants (A), participants with AD diagnosis at 90 months (B), and the control group (C). There is a significant difference in Spearman's correlation coefficient (r) between the AD at 90 months and the control group (AD r = 0.75, controls r = −0.06, p < 0.001). Correlations are visualized by least‐squares regression line. AD, Alzheimer's disease; NfL, neurofilament light chain; PRS‐CS, polygenic risk score continuous shrinkage.
