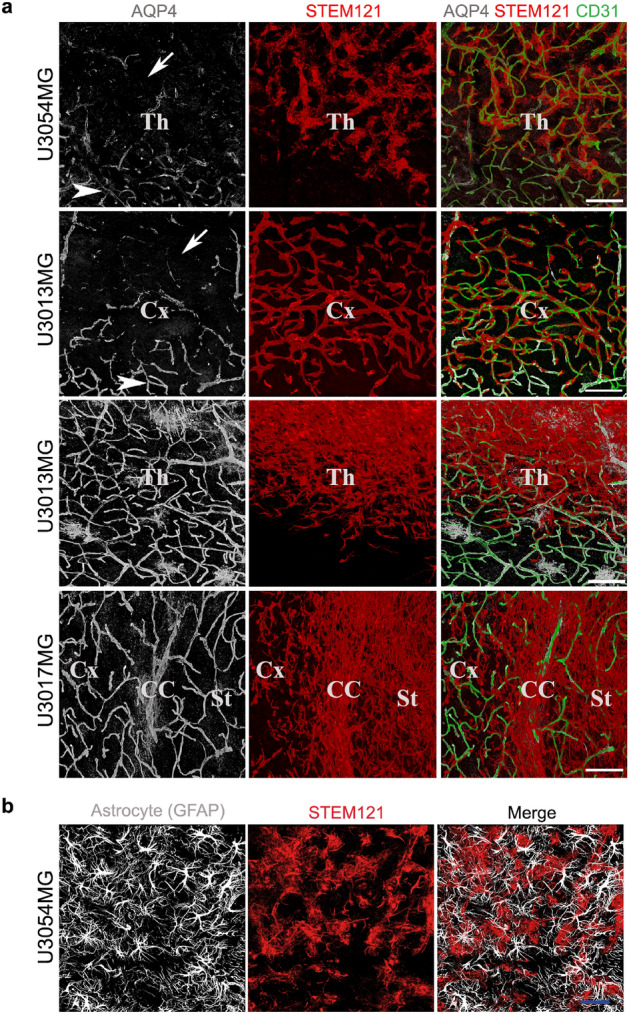
Figure 3.

(a) Loss of astrocyte end-feet in regions of high-level vessel-associated glioma cells. Immunofluorescent staining of human glioma cells (STEM121, red), astrocyte end-feet (AQP4, white), and blood vessels (CD31, green) on coronal brain sections. z-stacks were taken by Leica confocal microscope using 63 × objective in tile scan mode to cover a large area. Each image represents a snapshot of a 3D image. Arrow indicates the glioma cell occupied region with loss of astrocyte end-feet and arrowheads indicate regions with visibly no loss of astrocyte end-feet from vessels. Cx cortex, Th thalamus, CC corpus callosum, St striatum. Scale bar: 100 µm. For astrocyte end-feet analysis data on all tumors, see Supplementary Fig. 3. (b) U3054MG tumor section (thalamus) stained with GFAP and STEM121 antibodies. Scale bar, 100 µm.
