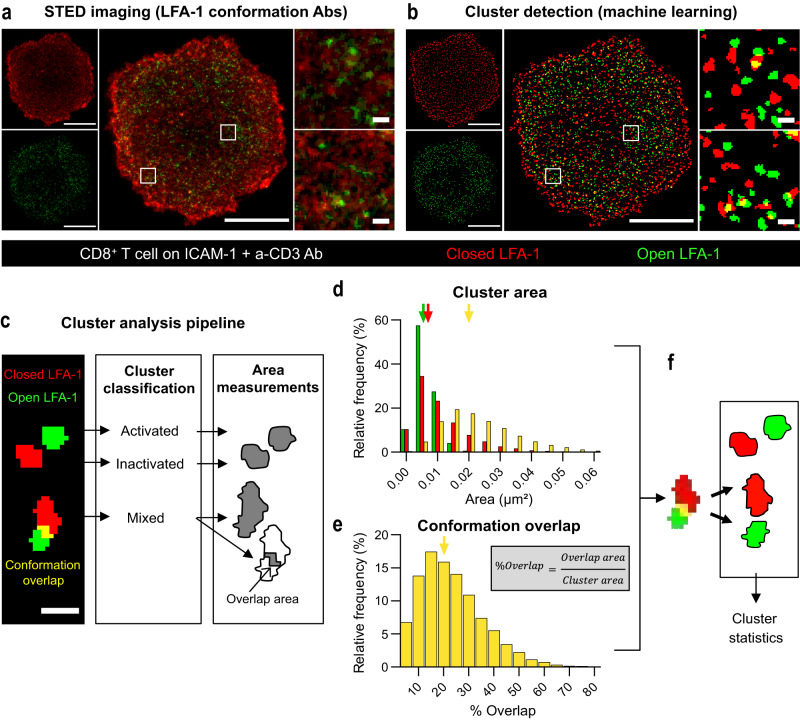
Fig. 1. Nanoscale organization of LFA-1 at the CD8+ T cell synapse.
a STED image of the adhesion plane of a representative CD8+ T cell spreading on ICAM-1 + anti-CD3 Ab for 20 min prior to fixation. Closed (red) and open (green) conformations of LFA-1, as revealed with Hi-111 and m24 Ab, respectively. Image from one experiment out of two independent experiments. Scale bars: 5 µm (whole cell) and 0.2 µm (ROI). b LFA-1 clusters as detected by the Trainable Weka Segmentation algorithm applied to the STED image presented in (b). c Representative nanocluster types (scale bar: 150 nm) were further processed to extract nanocluster area (for closed, open and mixed clusters) and conformation overlap area (for mixed clusters). d Distribution of nanocluster areas (28 cells studied, from two independent experiments). The arrows point to the median area of the closed (red), open (green) and mixed (yellow) clusters, which are, respectively, 0.0054, 0.0068 and 0.0201 µm2. e Distribution of the percentage of conformation overlap in the nanoclusters detected as mixed (28 cells studied, from two independent experiments). The arrow indicates the median value (20%). f Schematic representation of the treatment of mixed cluster events: since they display limited conformation overlap and their size exceeds that of single-conformation nanoclusters, these events are considered as juxtaposed nanoclusters. Source data are provided as a Source Data file.

