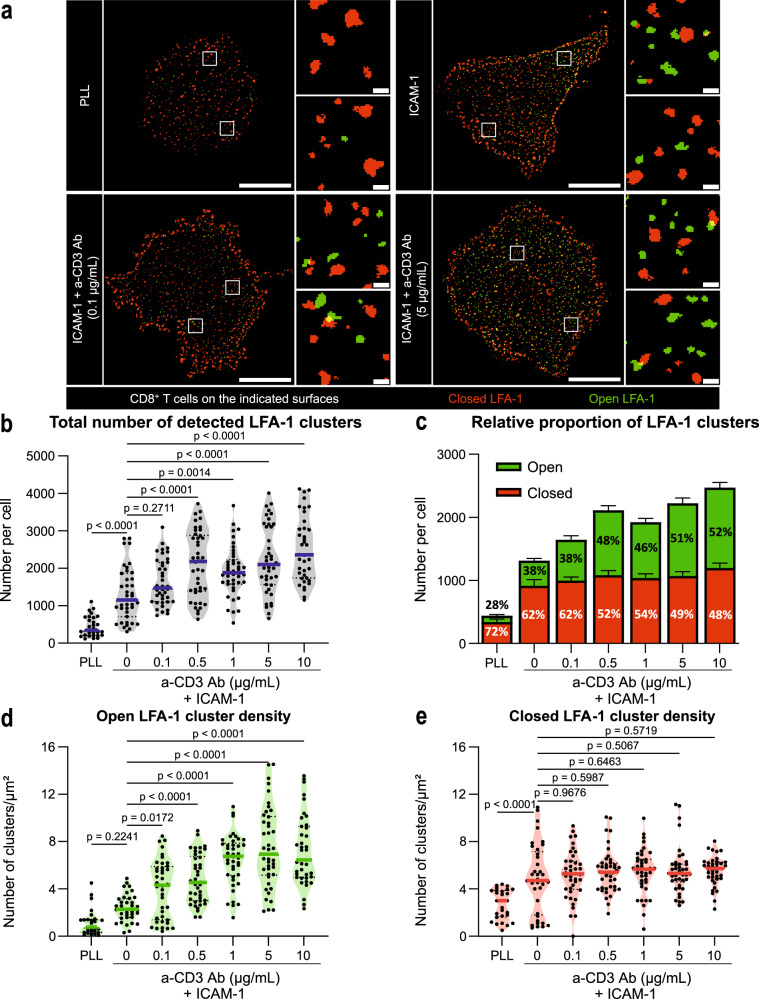
Fig. 2. Conformational state of LFA-1 nanoclusters as a function of TCR stimulation.
a LFA-1 nanoclusters as detected by the segmentation algorithm from STED images of CD8+ T cells spreading over the indicated surfaces. Closed (red) and open (green) LFA-1 conformations, as revealed with Hi-111 and m24 Ab, respectively. Scale bars: 5 µm (whole cell) and 0.2 µm (ROI). b Total number of LFA-1 nanoclusters detected at the adhesion plane of T cells spreading over the indicated surfaces. c Number and proportion of closed or open clusters. Densities of open (d) and closed (e) LFA-1 nanoclusters. b–e Pooled results of three independent experiments conducted on T cells from two donors. In total, 27, 38, 40, 42, 41, 42 and 39 cells were studied, respectively for PLL, 0, 0.1, 0.5, 1, 5 and 10 µg/ml anti-CD3 Ab. Dots: individual cells, lines: median, bars: SEM. p values calculated by parametric one-way ANOVA tests. Source data are provided as a Source Data file.

