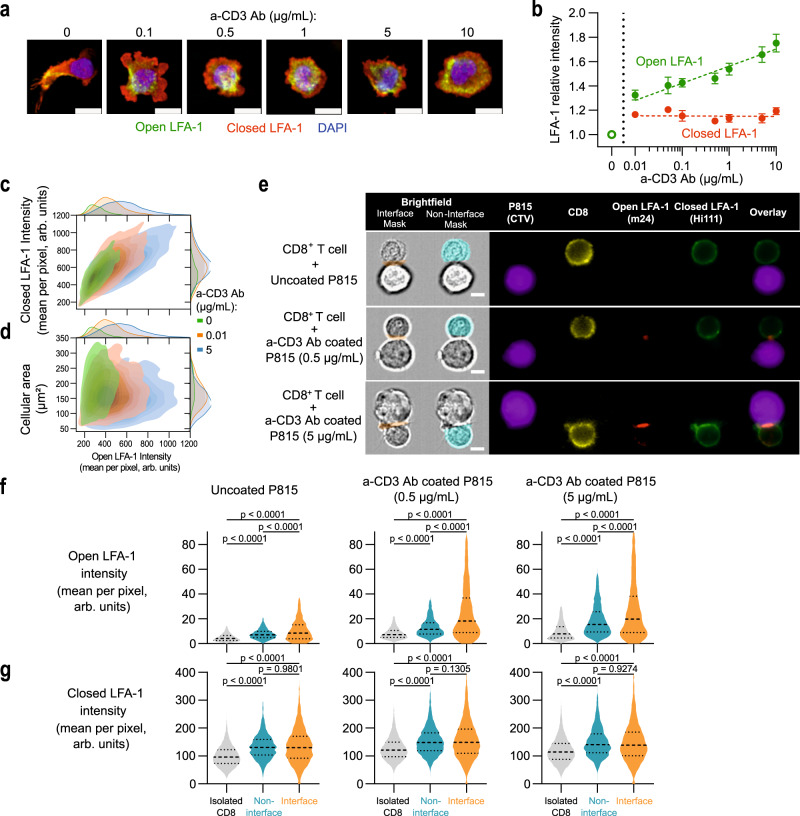
Fig. 3. Single-cell analysis of LFA-1 conformation activation at the CD8+ T-cell synapse.
a Representative images of CD8+ T cells spreading on ICAM-1 and the indicated concentrations of a-CD3 Ab. Blue: nucleus, red: closed LFA-1, green: open LFA-1. Scale bar: 10 µm. b Relative intensity (compared to ICAM-1 alone) of closed (red) and open (green) LFA-1 of cells adhering to ICAM-1 and the indicated concentrations of anti-CD3 Ab. Each symbol represents the mean and SEM of four independent experiments, each including two replicates. The number of studied cells are 3143, 5694, 7159, 8164, 8143, 8421, 8750 and 9317, respectively for the 0 to 10 µg/ml anti-CD3 Ab conditions. Dotted lines represent linear regression on the mean values type a*log[a-CD3 concentration] + b. The slope is significantly positive for open LFA-1 (p value < 0.0001) but not significantly different to zero for closed LFA-1 (p value: 0.8925). c Distribution of closed and open LFA-1 intensities across individual cells. One representative experiment aggregating two duplicates among four independent experiments is shown. d Distribution of cellular area and open LFA-1 intensity across individual cells. One representative experiment aggregating two duplicates among four independent experiments is shown. e Representative images of CD8+ T cells in contact with P815 cells coated with the indicated concentrations of anti-CD3 Ab, acquired with a flow imager. Scale bar: 5 µm. Intensity of m24 (f) and Hi-111 Ab (g) in isolated CD8+ T cells (gray) or CD8+ T cells in contact with P815 cells (blue: non interface, orange: interface). The data of two independent experiments are pooled. The bars represent the first, second (median) and third quartile. p values calculated by parametric one-way ANOVA tests. Gating strategy exposed in Supplementary Fig. 4a. Source data are provided as a Source Data file.

