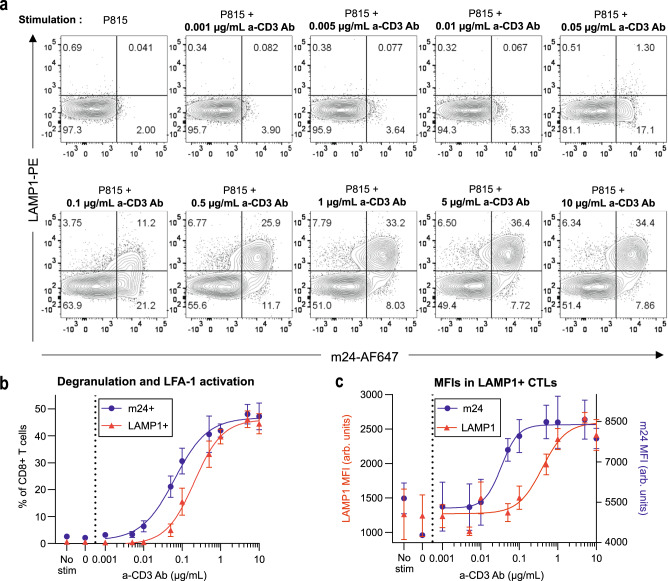
Fig. 4. Relationship between LFA-1 activation and lytic granule exocytosis.
a Flow cytometry analysis of LAMP1 and m24 stainings of CD8+ T cells stimulated by P815 cells coated with the indicated concentrations of anti-CD3 Ab. One representative experiment among three independent experiments is shown. N = 10,000 cells per condition. b Percentage of LAMP1+ (red) and m24+ (blue) CD8+ T cells after 2-h stimulation with P815 cells coated with the indicated concentrations of a-CD3 Ab. The dots represent the mean of three independent experiments (each with 30,000 cells per condition) and error bars correspond to SEM. The lines represent sigmoidal fits. Corresponding gates are shown in (a). c Mean fluorescence intensity (geometric mean, MFI) of LAMP1 (red, left axis) and m24 (blue, right axis) in LAMP1+ T cells. The dots represent the mean of three independent experiments (each with 30,000 cells per condition) and error bars correspond to SEM. The lines represent sigmoidal fits. Gating strategy exposed in Supplementary Fig. 5a. Source data are provided as a Source Data file.

