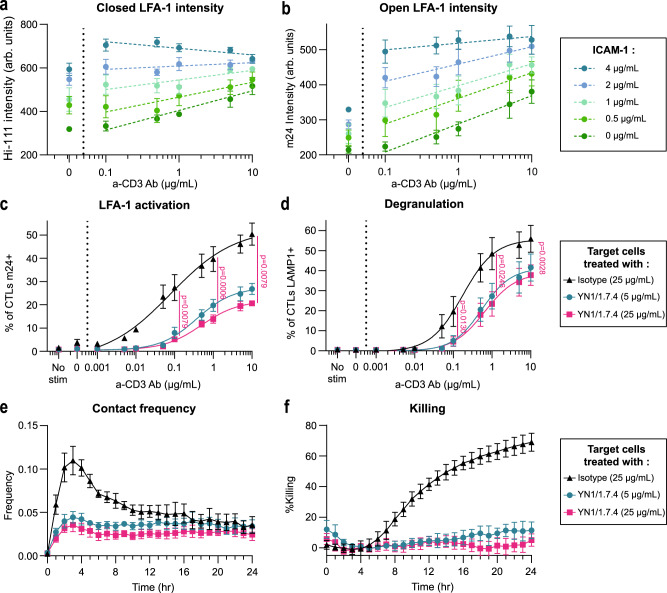
Fig. 7. Influence of ICAM-1 availability on TCR-evoked LFA-1 activation.
Fluorescence intensities of the closed (a) and open (b) LFA-1 conformations, as calculated from high-throughput confocal images of CD8+ T cells of the same donor spreading on the indicated concentrations of ICAM-1 and anti-CD3 Ab. Each symbol represents the mean and SEM of three independent experiments, each including two replicates. Dotted lines represent linear regression on the mean values type a*log[a-CD3 concentration] + b. Percentage of CD8+ T cells detected by flow cytometry as positive for surface expression of open conformation LFA-1 (c) and LAMP1 (d) upon stimulation with P815 cells coated with the indicated anti-CD3 Ab concentrations and the addition of the anti-ICAM-1 Ab YN1/1.7.4. Mean and SEM of three independent experiments. The lines represent sigmoidal fits. N = 30,000 cells per condition. The significance of the differences between the curves is determined with two-sided ratio paired t-tests. e Contact frequency between P815 cells coated with anti-CD3 Ab (0.2 µg/ml) and CD8+ T cells, defined as the number of contacts divided by the number of live targets. Each symbol represents the mean and SEM of two independent experiments, each including quadruplicate values. f Percentage of killing of the P815 cells coated with 0.2 µg/ml anti-CD3 Ab calculated from the number of residual alive P815 cells at the considered time points. Symbols represent the mean and SEM of two independent experiments, each with four replicates. Source data are provided as a Source Data file.

