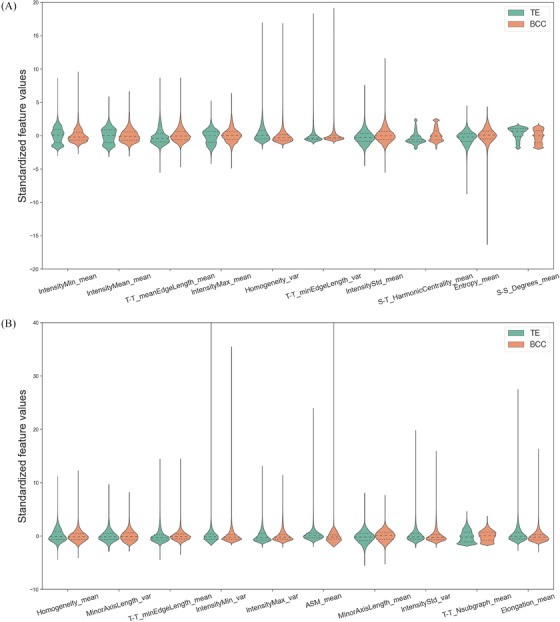
FIGURE 3.

Discriminative features of the differentiation classifier. (A) Top 1 to top 10 nuclear features. (B) Top 11 to top 20 features. Violin plots are used to visualize and compare features expression between BCC and TE. These 20 dimensions nuclear features were statistically different between BCC (orange) and TE (green) (p < 0.05). BCC, basal cell carcinoma; TE, trichoepithelioma.
