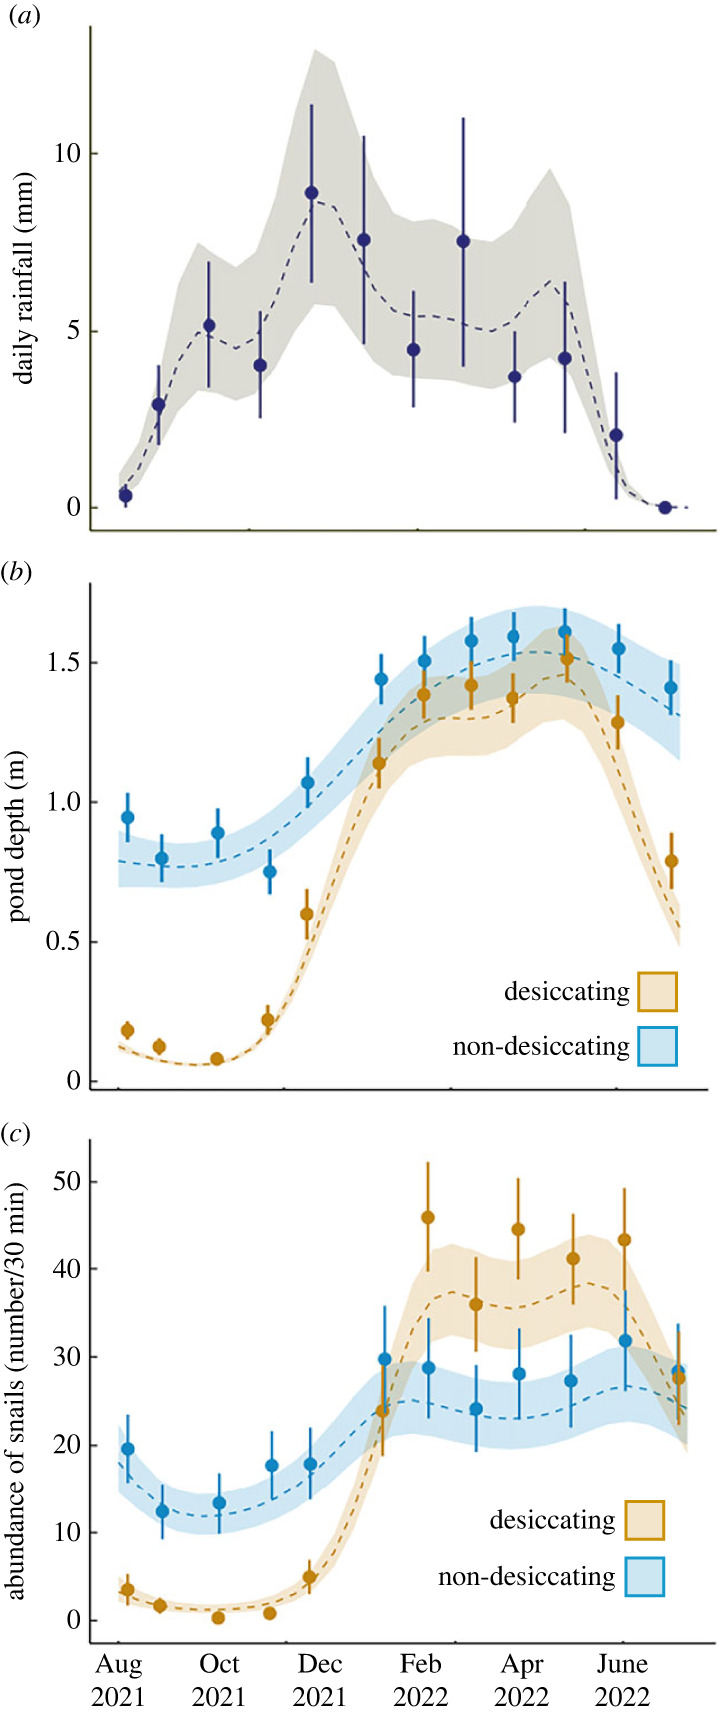
Figure 3.

Generalized Additive Models (GAMMs) representing circannual (a) rainfall patterns (mm per day) in Mwanza, Tanzania of data from the airport weather station, and variability in (b) pond depth (m) and (c) Bulinus nasutus snail abundance (number collected in 30 min survey) in our 109 sites. The shaded region surrounding the line represents the best fit ± 1 s.e. Points represent monthly means and standard error. Depth and snail abundance were significantly nonlinear and different between the two ephemerality categories.
