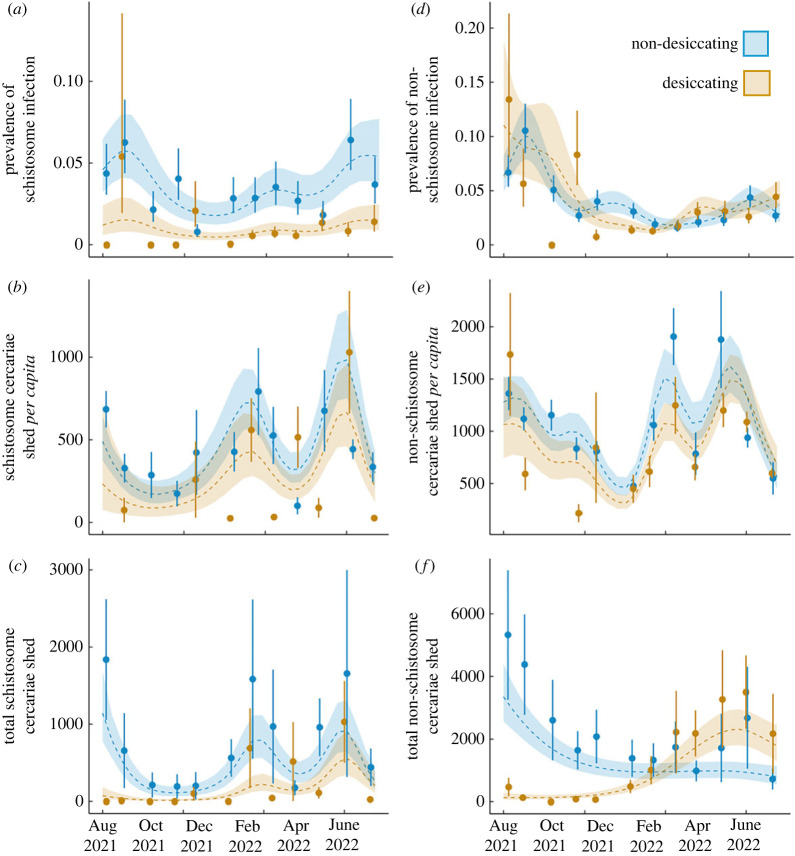
Figure 4.
GAMMs representing circannual (a) schistosome prevalence, (b) schistosome per capita cercariae observed, (c) schistosome total cercaria release per survey, (d) non-schistosome prevalence, (e) non-schistosome per capita cercariae observed, and (f) non-schistosome total cercaria observed per survey in desiccating and non-desiccating ponds. The shaded region surrounding the line represents the best fit ± 1 s.e. Points represent monthly means and standard error. All patterns were significantly nonlinear and different between the two ephemerality categories, except per capita cercariae observed was equivalent between two pond types.

