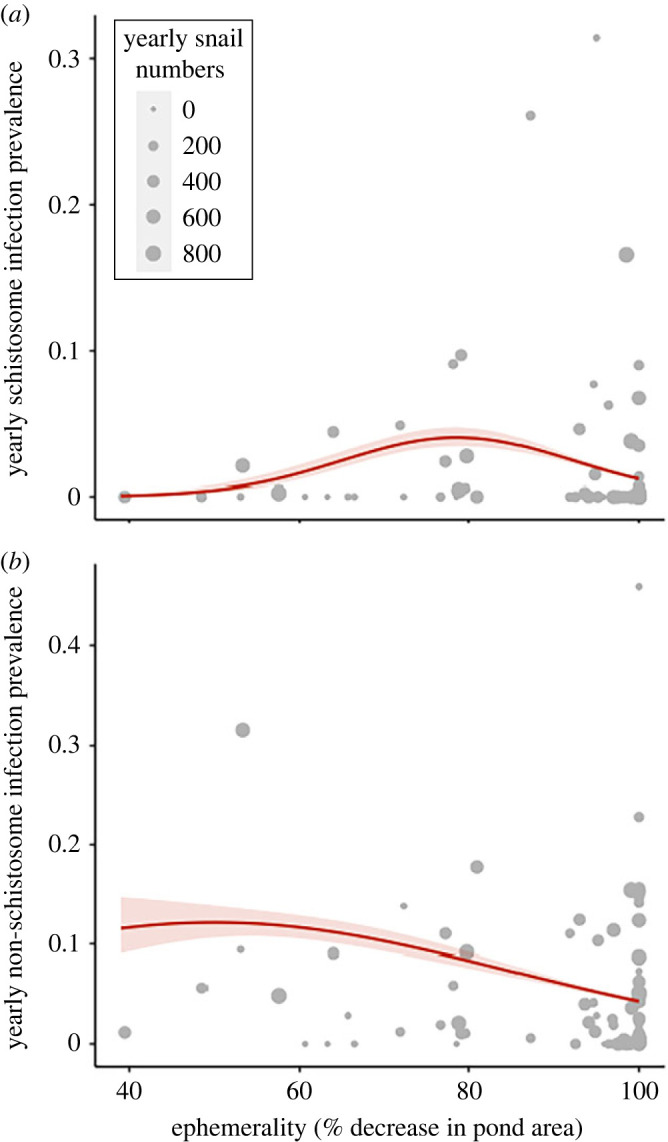
Figure 5.

Overall yearly (a) schistosome and (b) non-schistosome trematode infection prevalence in across an ephemerality gradient (% decrease in pond area in the dry season). The shaded region surrounding the line represents the best fit with 95% CI. Points represent yearly prevalence in each pond and the size is indicative of the number of snails collected in each pond per year. Schistosome prevalence peaks at intermediate ephemerality (approx. 80% area decrease, binomial GLM, p < 0.01). Non-schistosome prevalence peaks at low ephemerality (approx. 50% area decrease, binomial GLM, p < 0.01).
