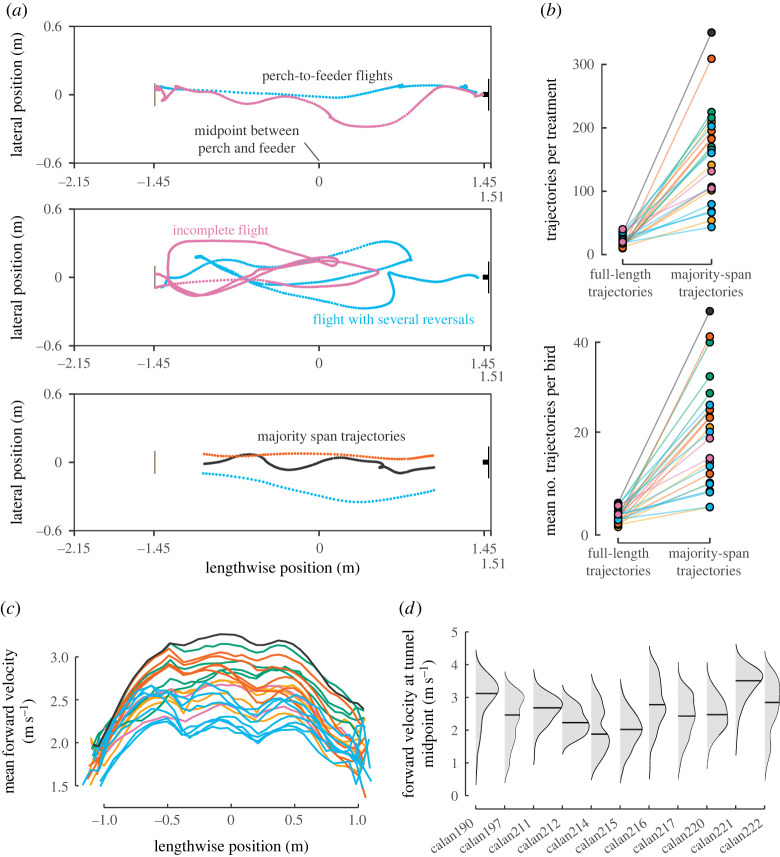
Figure 2.
Variation in flight trajectories within the tunnel. (a) Example trajectories of perch-to-feeder flight (top) and of an incomplete flight and a flight with several reversals (middle) are shown. (b) Perch-to-feeder flights were rare, so we focused on flights that spanned most of the tunnel length (a bottom), which are much more numerous. (c) The average of the instantaneous forward velocities is shown colour-coded by treatment (as in figure 1c) for each lengthwise position of the majority-span flights. (d) The distribution of velocities at the mid-tunnel position (0 m in c) is shown for each of the 11 hummingbirds in the study. Horizontal bars indicate the median velocity.

