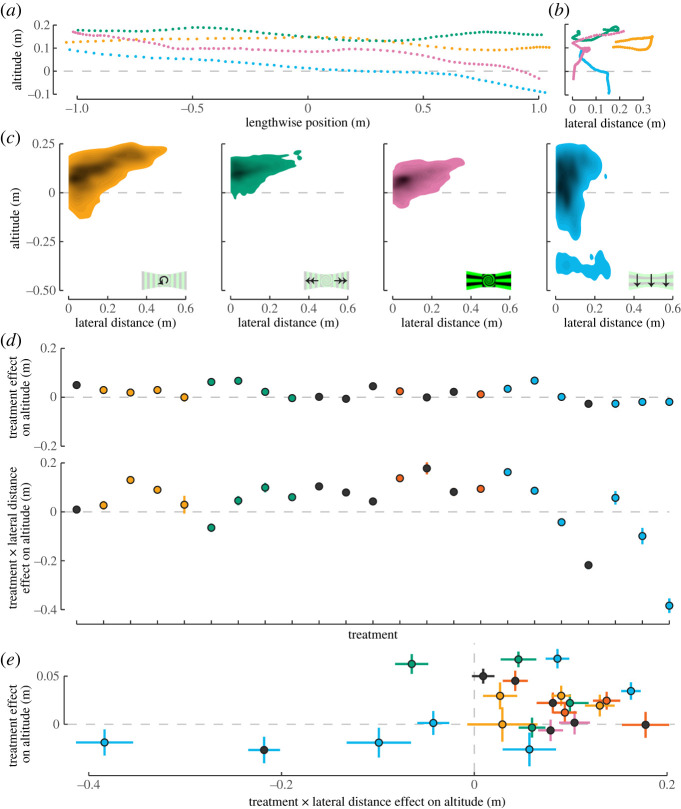
Figure 4.
Vertical optic flow stimuli induced corresponding changes in altitude during forward flight that were amplified by proximity to the stimulus. Four example trajectories from different treatments are shown here, plotting altitude versus (a) length position and (b) lateral distance. (c) Two-dimensional kernel densities for whole populations depict altitude versus lateral distance for the same four treatments. Darker colours indicate higher densities of trajectories. (d) All 23 treatments analysed in a single mixed model. The effects of stimulus treatment on altitude are shown in the upper panel. Bars indicate 95% confidence intervals. The order of treatments (left to right) matches the order displayed in figure 3a, top to bottom. Effects on altitude due to the interaction between stimulus treatment and lateral distance are shown below. (e) The two effects from (d) are plotted against each other, illustrating the gain in response due to wall proximity.

