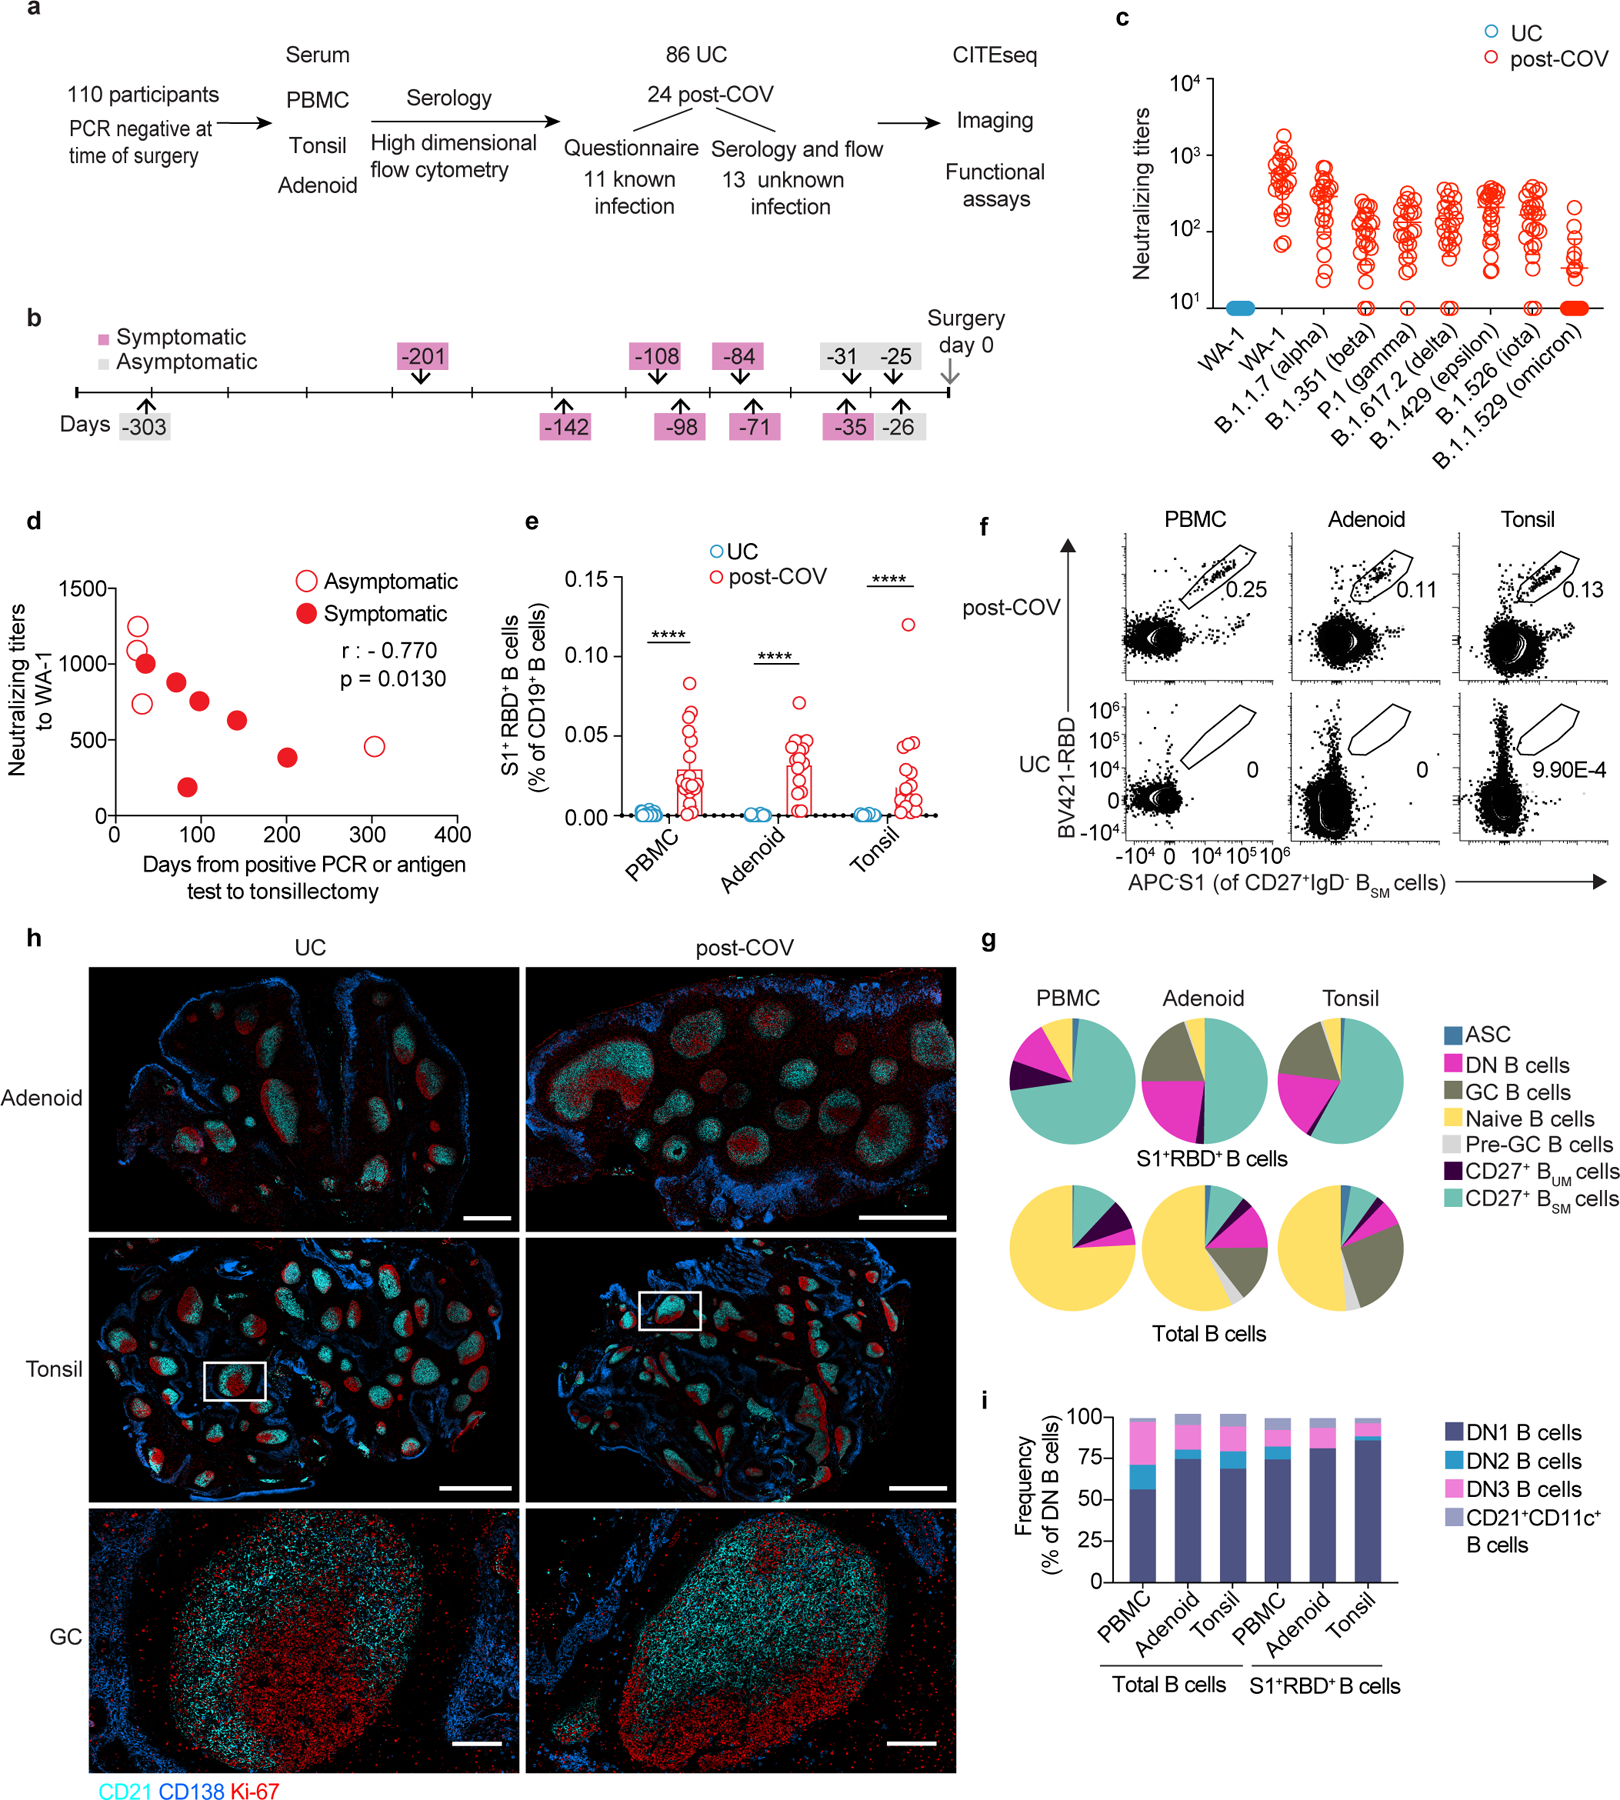
Figure 1. SARS-CoV-2 elicits robust humoral immune responses in children.

a. Enrollment of post-COVID-19 (post-COV) and uninfected control (UC) subjects and study design. b. Time from previous positive SARS-CoV-2 PCR/antigen test to tonsillectomy and/or adenoidectomy in 11 subjects with known prior infection. c. Neutralizing antibody titers (PsVNA50) against the early isolate WA-1 and seven other SARS-CoV-2 variants of interest (post-COV n=23, UC n=14). d. Correlation between neutralizing antibody titers to WA-1 and days from positive SARS-CoV-2 test to surgery (n=10). Spearman’s rank correlation (r) and p values are noted. e. Frequency of SARS-CoV-2-specific (S1+RBD+) cells among total CD19+ B cells from PBMCs, adenoids and tonsils from post-COV and UC donors (PBMC post-COV n=18, UC n=33; adenoid post-COV n=16, UC n=27; and tonsil post-COV n=16, UC n=30; all p<10−6). f. Representative flow cytometry plots showing the percentage of S1+RBD+ cells among IgD−CD38−CD27+CD19+ switched memory B cells (CD27+BSM) in post-COV PBMCs, adenoids and tonsils. g. Composition of S1+RBD+ B cells and total B cells from post-COV PBMCs (n=18), adenoids (n=16), and tonsils (n=16). Mean frequency of each B cell subset (defined in Supplementary Fig. 1-2) shown in pie chart. ASC: antibody secreting cells equivalent to plasma cells and plasmablasts, CD27+ BUM: CD27+IgD+ unswitched memory B, GC: germinal center, DN: double negative. h. Images of adenoids and tonsils showing GCs from one post-COV donor and one UC, representative of 3 post-COV and 3 UC donors. Inset shows close-up of GC and light (CD21, follicular dendritic cells, cyan) and dark zones (Ki-67, dividing cells, red). CD138 (plasma cell and epithelial cell marker) in blue. Bar represents 1mm in upper row, 2mm in middle, and 200μm in lower. i. Composition of S1+RBD+ IgD−CD27−CD38−CD19+ DN B cells and total DN B cells from post-COV PBMC (n=18), adenoids (n=16) and tonsils (n=16). Mean frequency of each DN subset shown in bar chart. Means ± S.D. are displayed in bar and scatter plots. Each dot represents one donor. Significance calculated with two-sided Mann-Whitney U test. ****p<0.0001.
