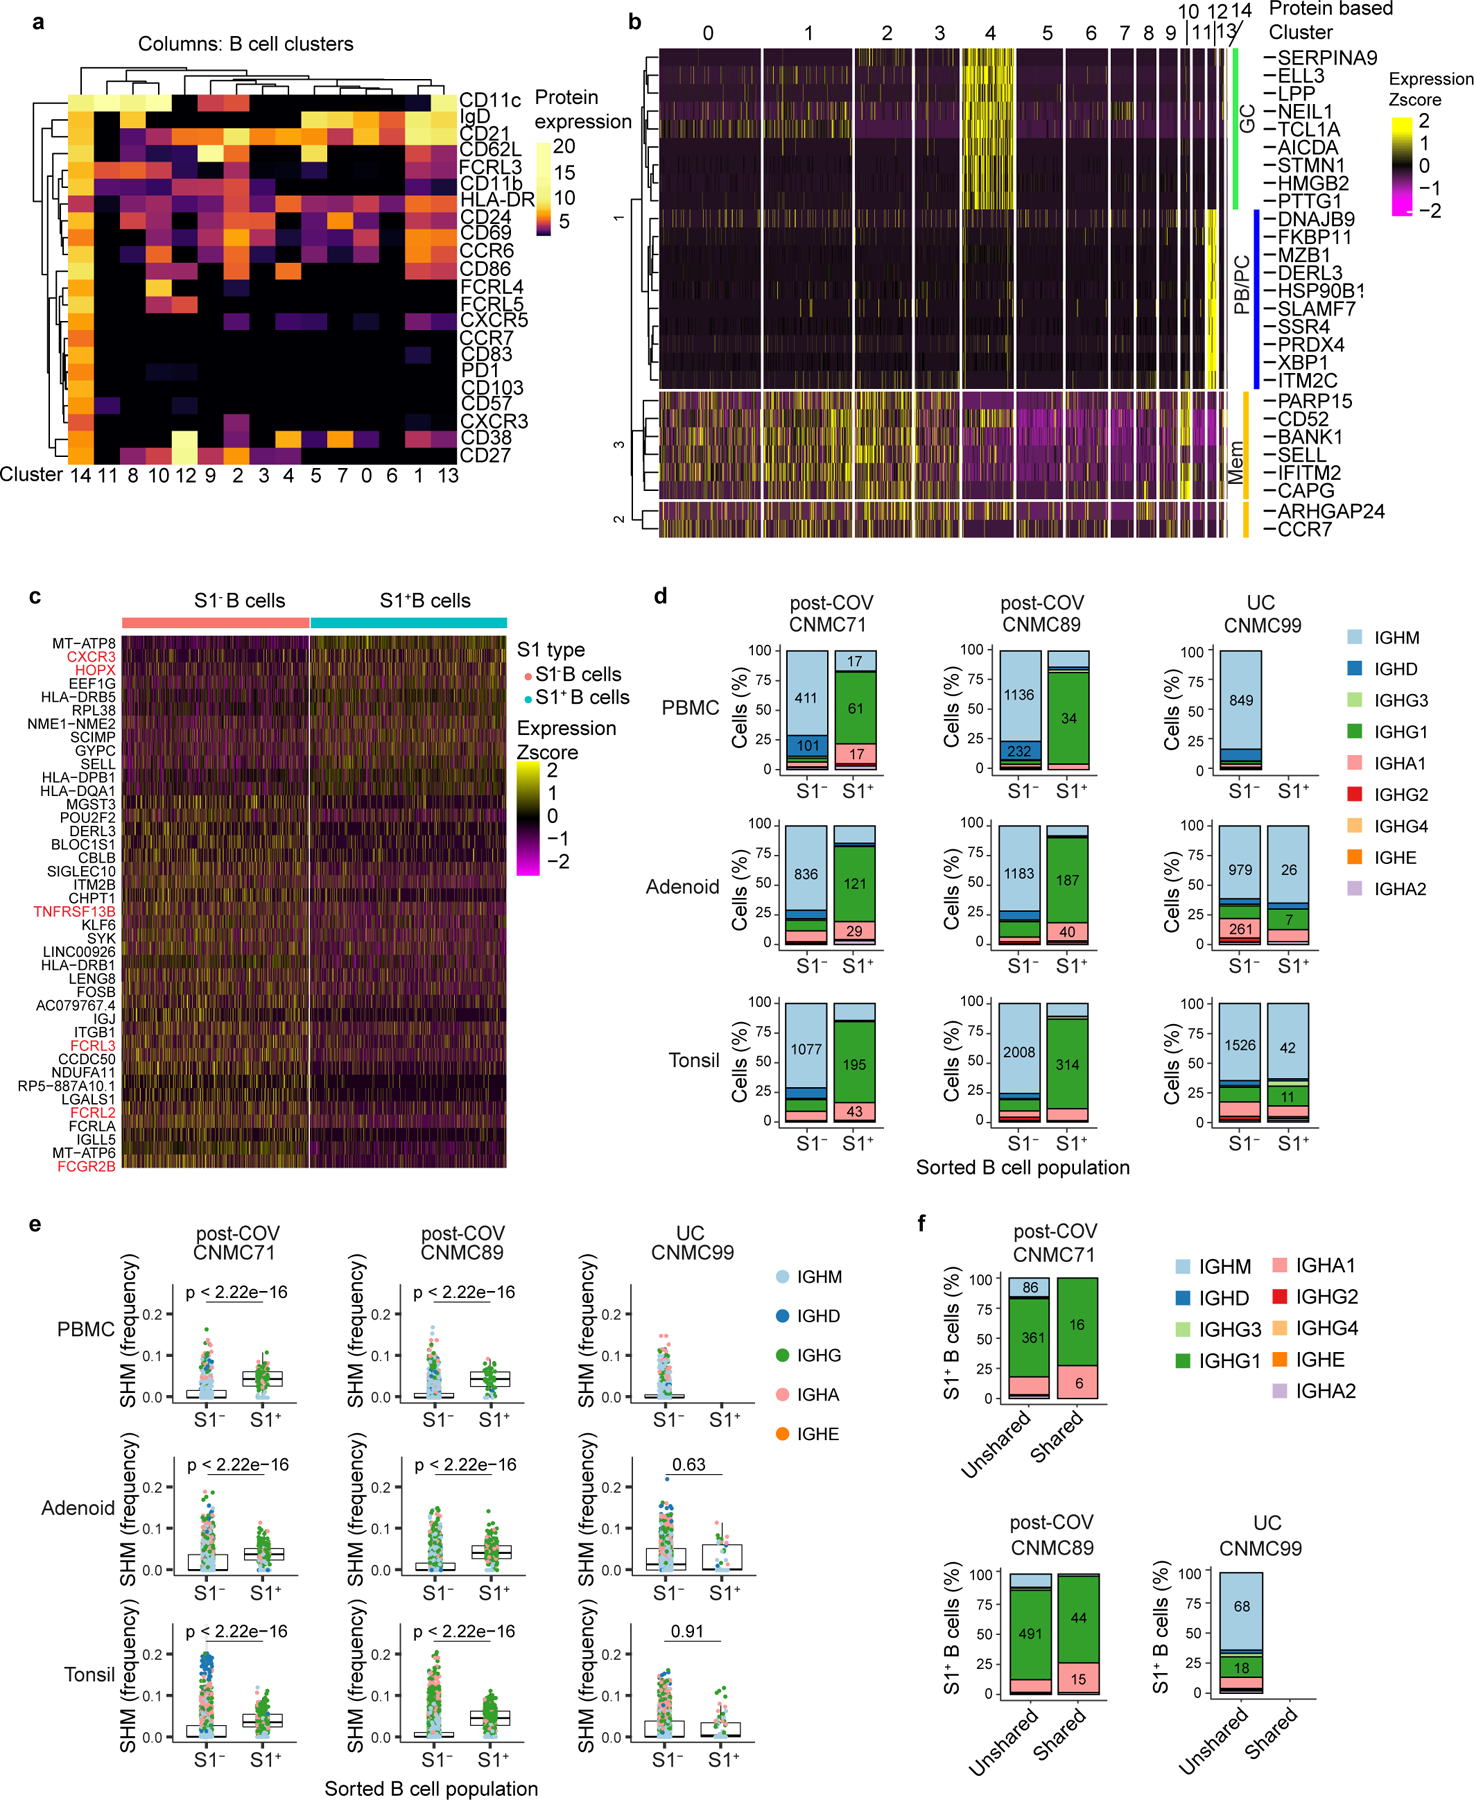
Extended Data Figure 2. CITE-seq analysis of SARS-CoV-2 antigen-specific B cells.

a,b. Heatmap of unsupervised clustering by CITE-seq antibody expression of S1+ and S1− B cells from tonsils, adenoids, and PBMCs from three donors (2 post-COV and 1 UC) yielding 15 clusters (a). Expression of signature gene sets for GC B cells, memory B (Mem) cells, and plasma cells/plasmablasts (PC/PB) among all B cells (S1+ and S1−) organized by cluster (b). c. Heatmap showing differentially expressed (DE) genes in S1+ vs. S1− B cells from tonsils and adenoids from cluster 2 (which are CD27+BSM cells), see Supplementary Table 5. d. Sub-isotype percentages among sorted S1+ and S1− B cells from adenoids, tonsils and PBMCs of 2 post-COV donors (CNMC71 and 89) and one UC (CNMC99). Raw number of cells with a given sub-isotype are labelled only for sub-isotypes that make up >10% of a given category. e. Somatic hypermutation (SHM) frequency (calculated in V gene) among sorted S1+ and S1− B cells of all isotypes from PBMCs, adenoids, and tonsils of each donor. Median ± quartiles and p values shown in plots. Significance calculated with two-sided Mann Whitney U test. CNMC71 PBMC S1+ n=101, S1− n=577 cells; CNMC89 PBMC S1+ n=44, S1− n=1491 cells; CNMC99 PBMC S1− n=1026 cells; CNMC71 adenoid S1+ n=191, S1− n=1177 cells; CNMC89 adenoid S1+ n=261, S1− n=1647 cells; CNMC99 adenoid S1+ n=40, S1− n=1593 cells; CNMC71 tonsil S1+ n=286, S1− n=1514 cells; CNMC89 tonsil S1+ n=416, S1− n=2644 cells; CNMC99 tonsil S1+ n=66, S1− n=2346 cells. f. Sub-isotype frequencies among S1+ B cells from clones shared between tonsil and adenoid and unshared clones. Raw number of cells with a given sub-isotype are labelled only for sub-isotypes that make up >10% of a given category.
