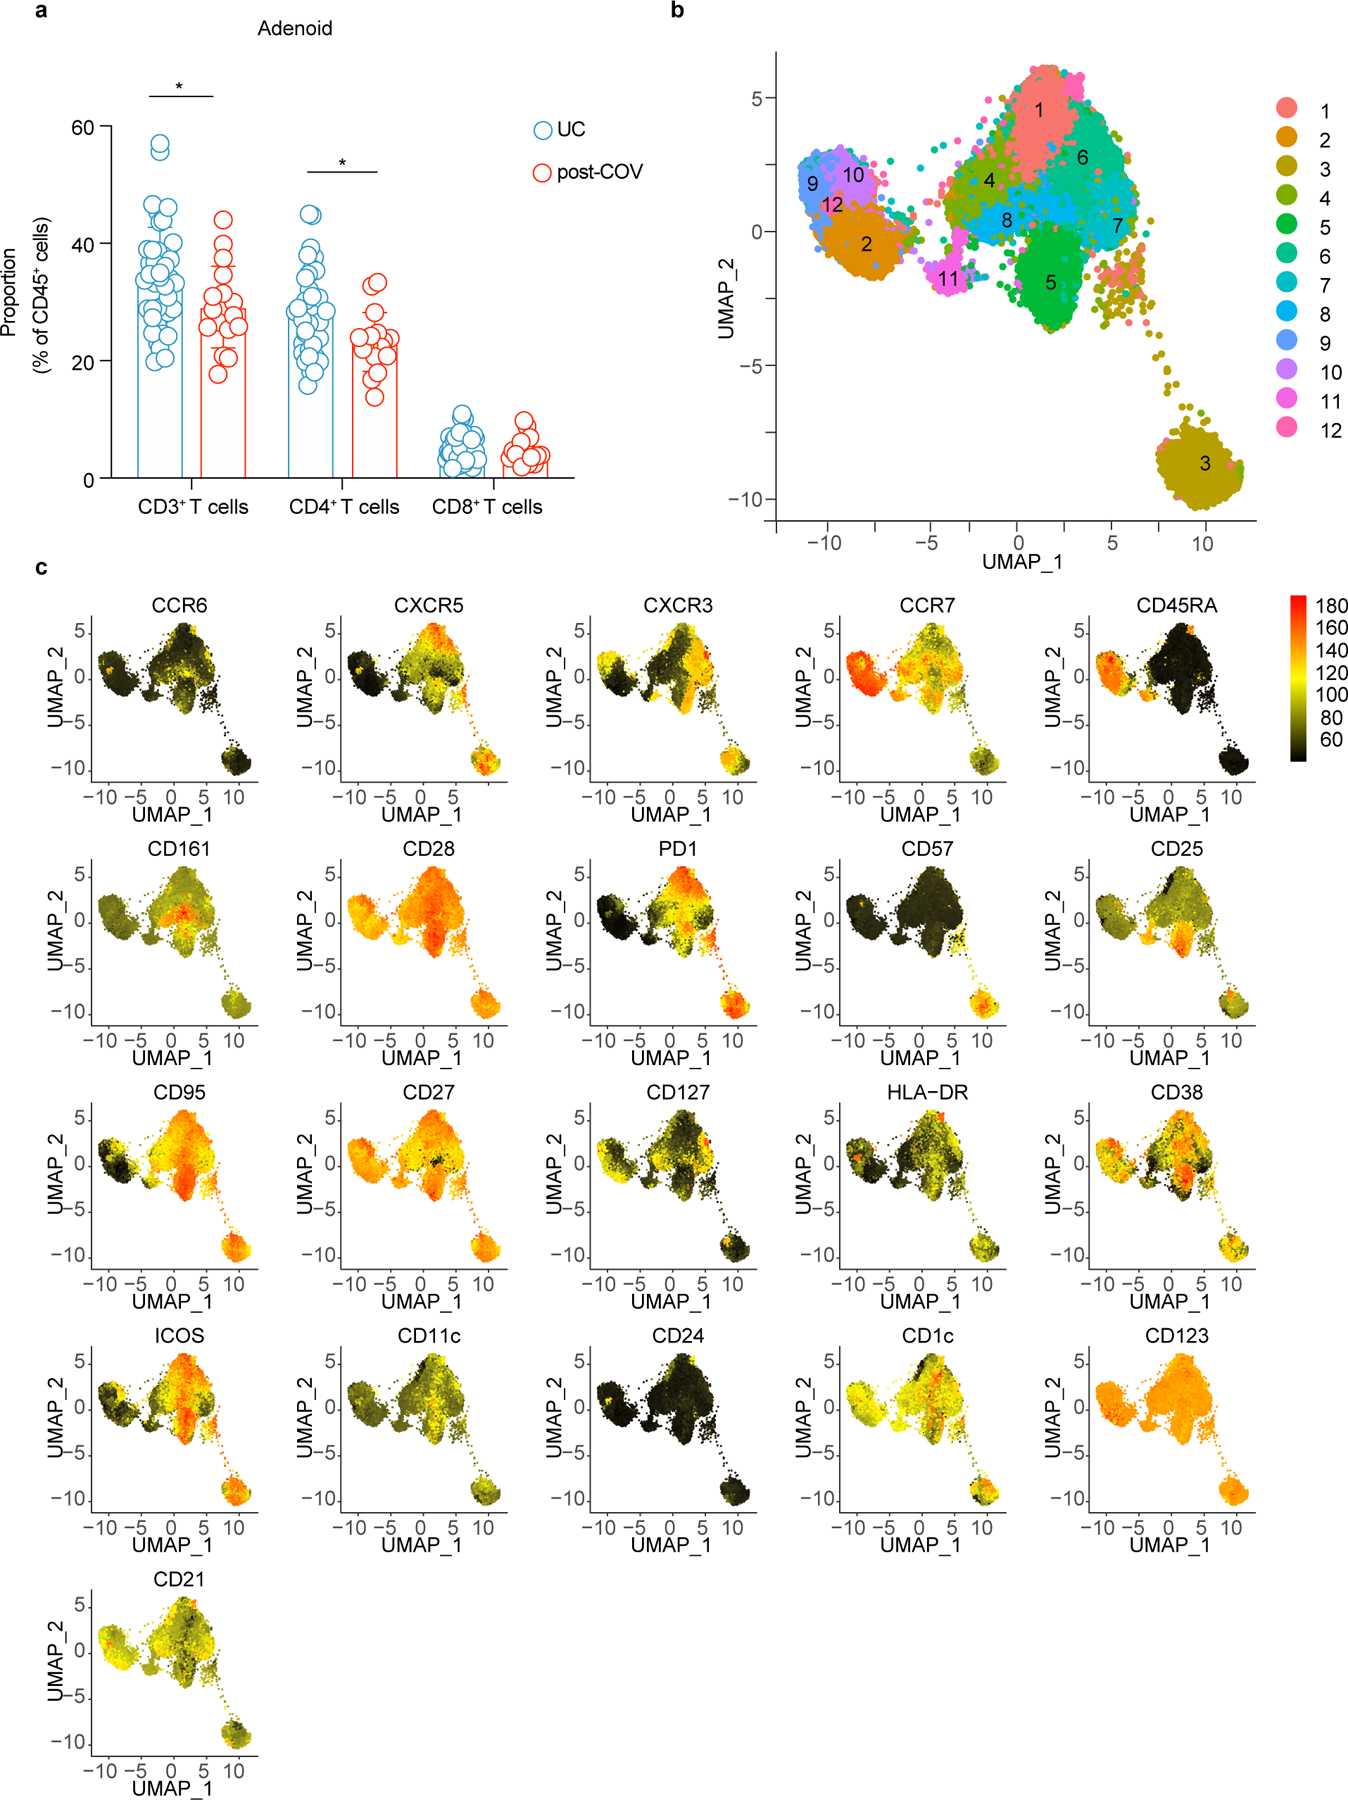
Extended Data Figure 4. UMAP of unsupervised clustering of CD4+ T cells from tonsil and adenoid.

a. Comparison of CD3+, CD4+, and CD8+ T cell frequency in adenoid of post-COV (n = 17) and UC donors (n = 42), CD3+ p value = 0.043, CD4+ p = 0.017. b, c. UMAP of unsupervised clustering of surface markers from flow cytometric analysis of CD4+ T cells from adenoid and tonsil (b) with heatmaps of marker/antibody expression overlayed (c).
