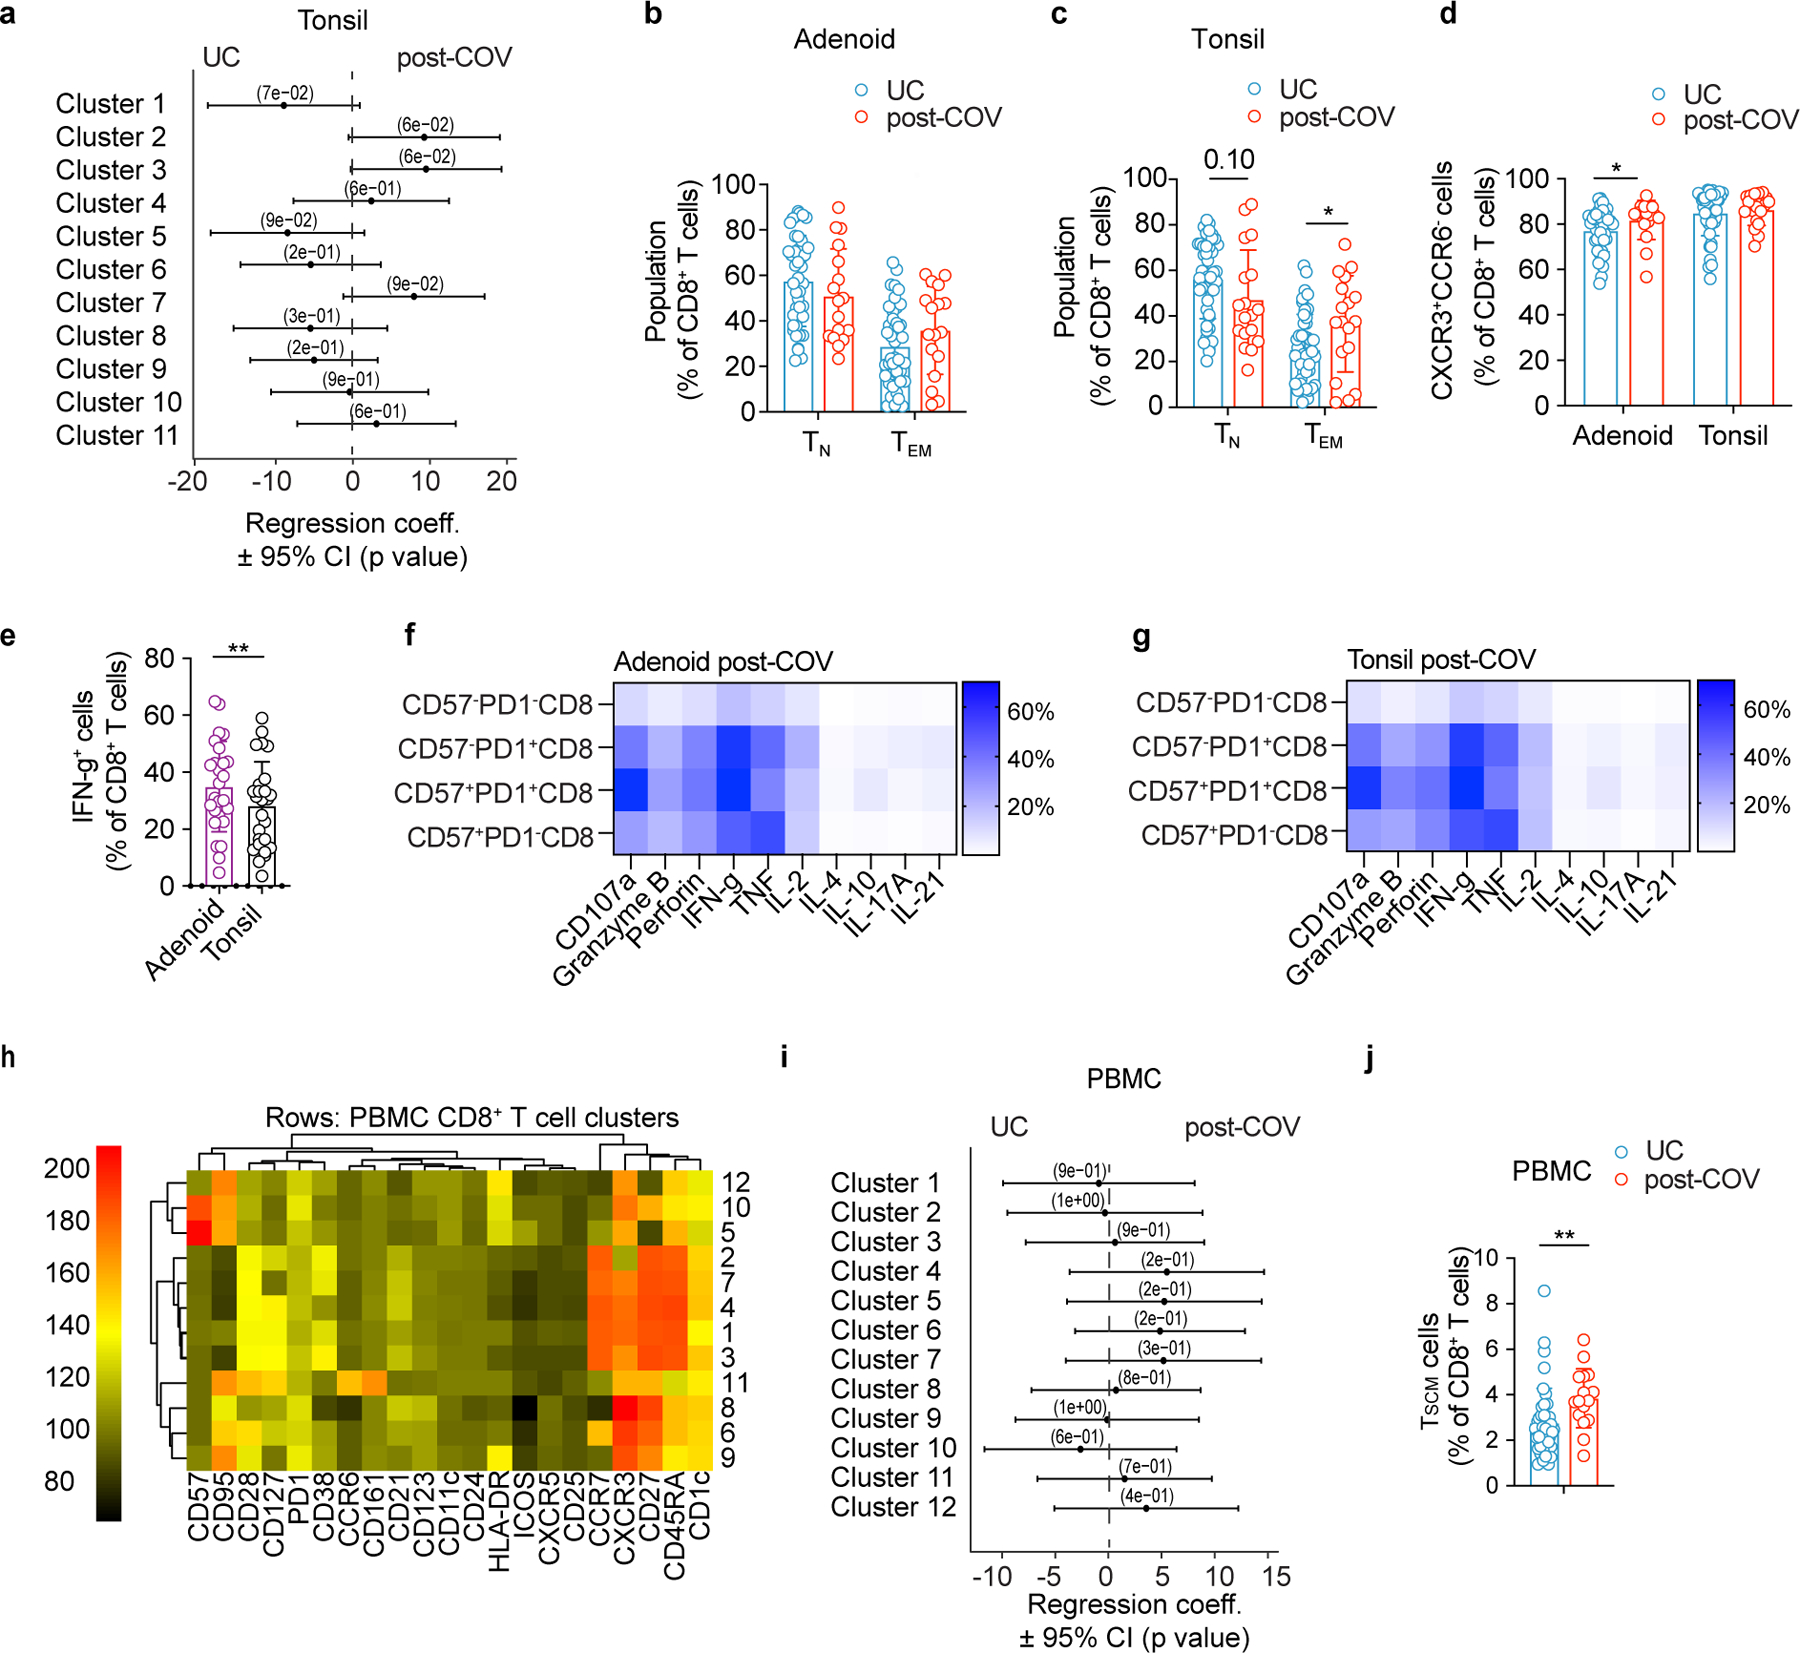
Extended Data Figure 8. Expanded CD8+ T cell populations after COVID-19.

a. Quantification of the effect of prior SARS-CoV-2 infection on CD8+ T cell clusters in tonsil showing regression coefficients ± 95% confidence intervals (CI) and p values, estimated with a linear model controlling for age and sex (post-COV n=15, UC n=42). b, c. Frequencies of CD45RA+CCR7+CD8+ naïve T (TN) and CD45RA−CCR7−CD8+ effector memory T (TEM) cells in post-COV and UC adenoids (b) and tonsils (c, p=0.035 for TEM). d. Frequency of CXCR3+CCR6− cells among CD8+ T cells in post-COV and UC adenoids (p=0.022) and tonsils. e. Comparison of IFN-γ production by CD8+ T cells in adenoids and tonsils following PMA/ionomycin stimulation (n=26 for each tissue, p=0.003). f, g. Intracellular cytokine/cytotoxic factor production by different CD8+ T cell subsets gated by CD57 and PD-1 from post-COV adenoids (f, n=13) and tonsils (g, n=13). Mean cell frequency shown in heatmap. h. Unsupervised clustering of CD8+ T cells from PBMCs according to surface antibodies from flow cytometric analysis. No clusters showed significant differences (p<0.05) in post-COV (n=13) and UC (n=34) samples. i. Quantification of the effect of prior SARS-CoV-2 infection on CD8+ T cell clusters in PBMCs showing regression coefficients ± 95% CI and p values, estimated with a linear model controlling for age and sex. j. Frequency of CD45RA+CCR7+CD28+CD27+CD95+ CD8+ T stem cell-like memory (TSCM) in post-COV (n=16) and UC (n=41) PBMCs (p=0.002). For panels b-e, adenoids post-COV n=17, UC n=42, tonsils post-COV n=18, UC n=46. Each symbol represents one donor. Means ± S.D. displayed on bar plots. Significance calculated with two-sided Mann-Whitney U test. *p<0.05, **p<0.01.
