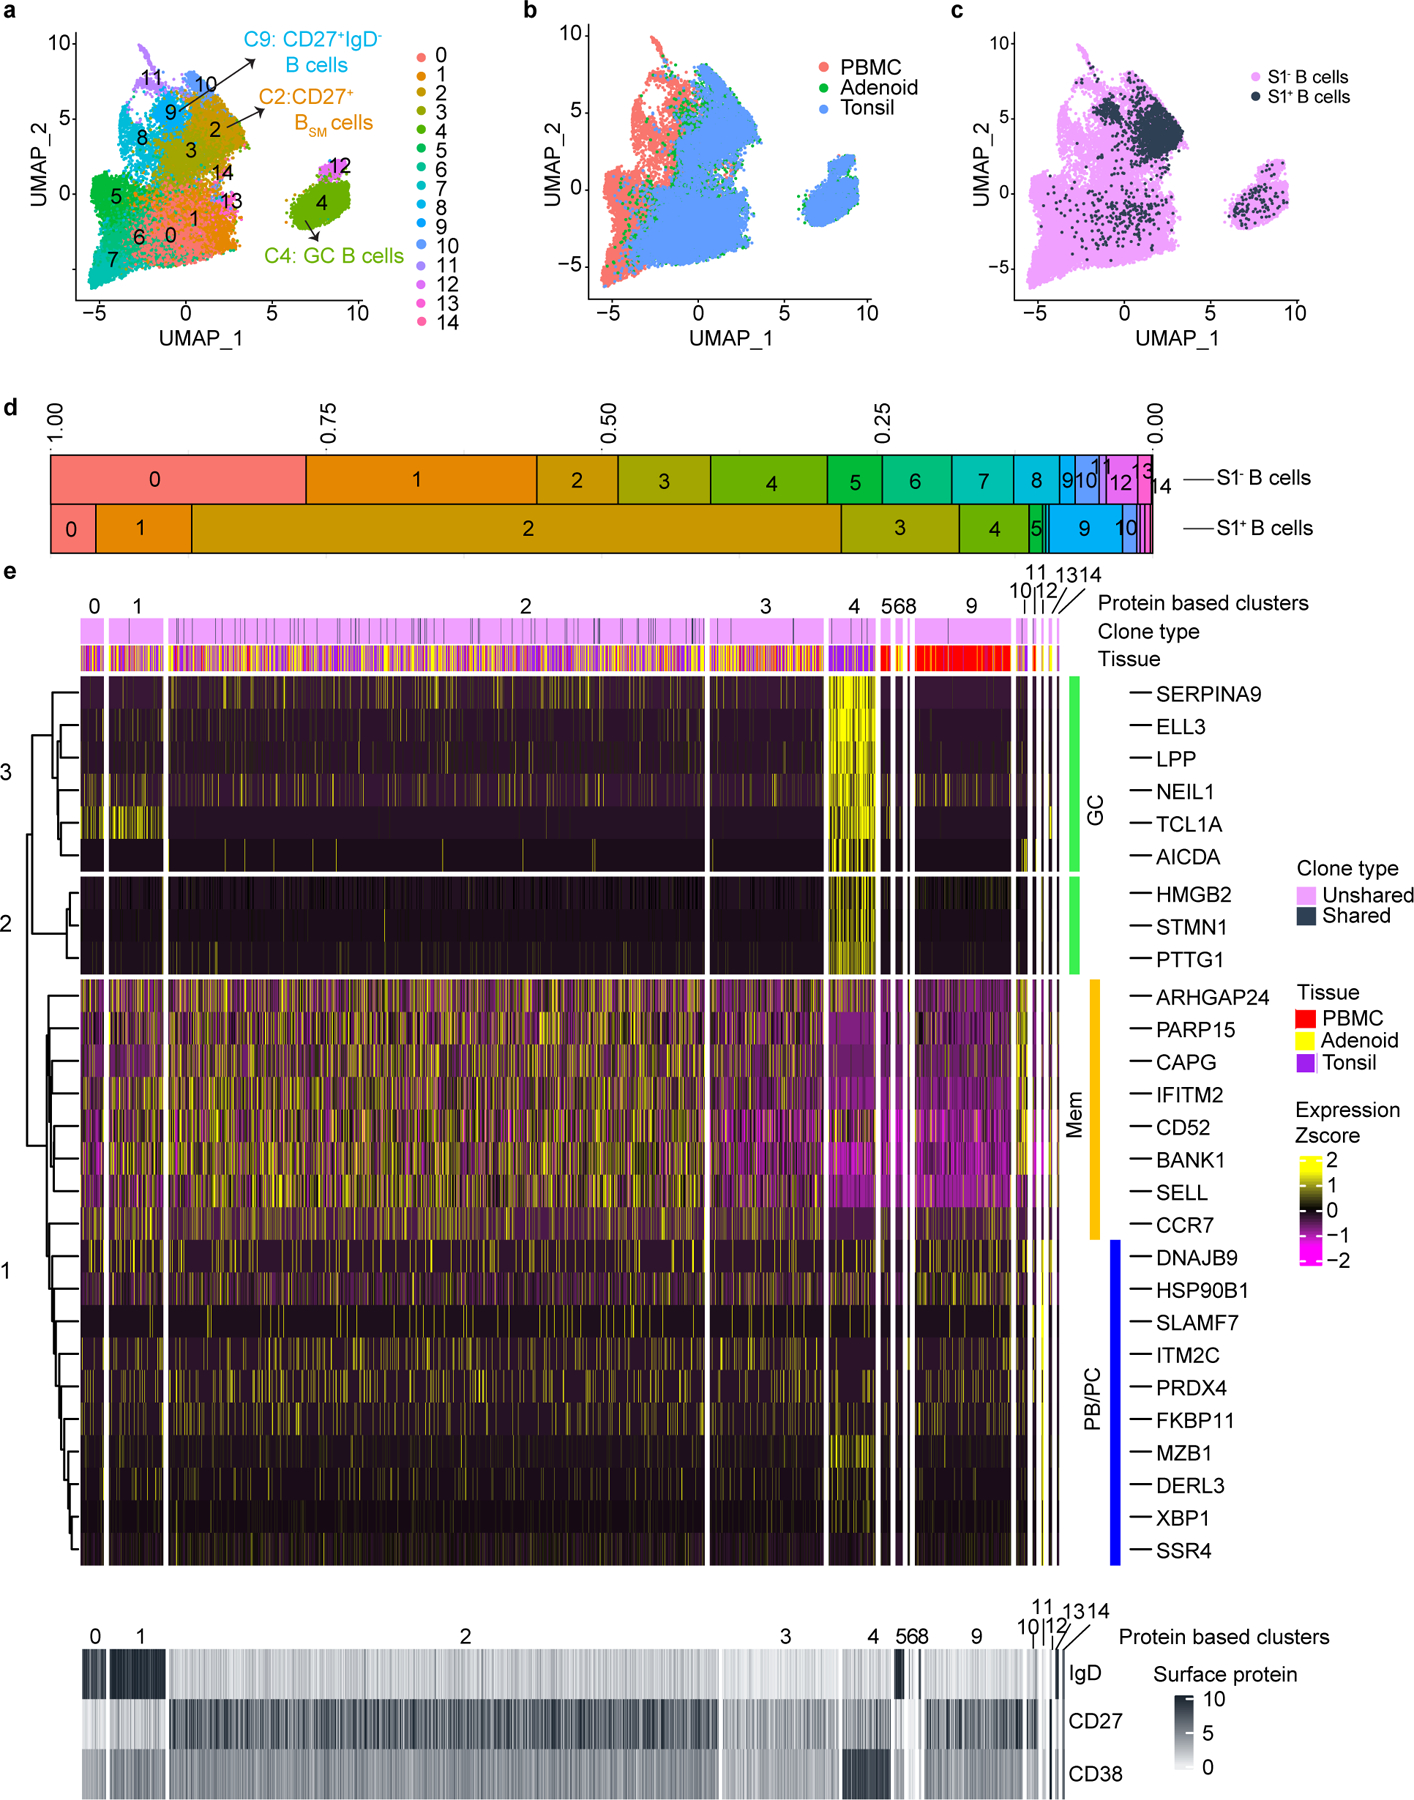
Figure 2. CITE-seq analysis of SARS-CoV-2 antigen-specific B cells.

a. Uniform manifold approximation and projection (UMAP) showing 15 clusters of sorted S1+ and S1− B cells (see Supplementary Fig. 3) from tonsils, adenoids, and PBMCs from 2 post-COV (CNMC71 and CNMC89) and one UC (CNMC99) donors clustered according to CITE-seq surface antibody expression. b. Tissue distribution of S1+ and S1− B cells in a. c. Distribution of S1+ B cells among clusters in a. d. Proportion of each of the 15 clusters among S1− and S1+ B cells in a. e. Heat map showing expression of signature gene sets for GC B cells, memory B cells (Mem), and plasma cells/plasmablasts (PB/PC)14 among S1+ B cells organized by cluster. IgD, CD38, and CD27 CITE-seq antibody expression are shown in lower heat map in grey. Tissue origin is shown in purple (tonsil), yellow (adenoid), and red (PBMC). Clones shared between tonsil and adenoid are marked in black in the top bar.
