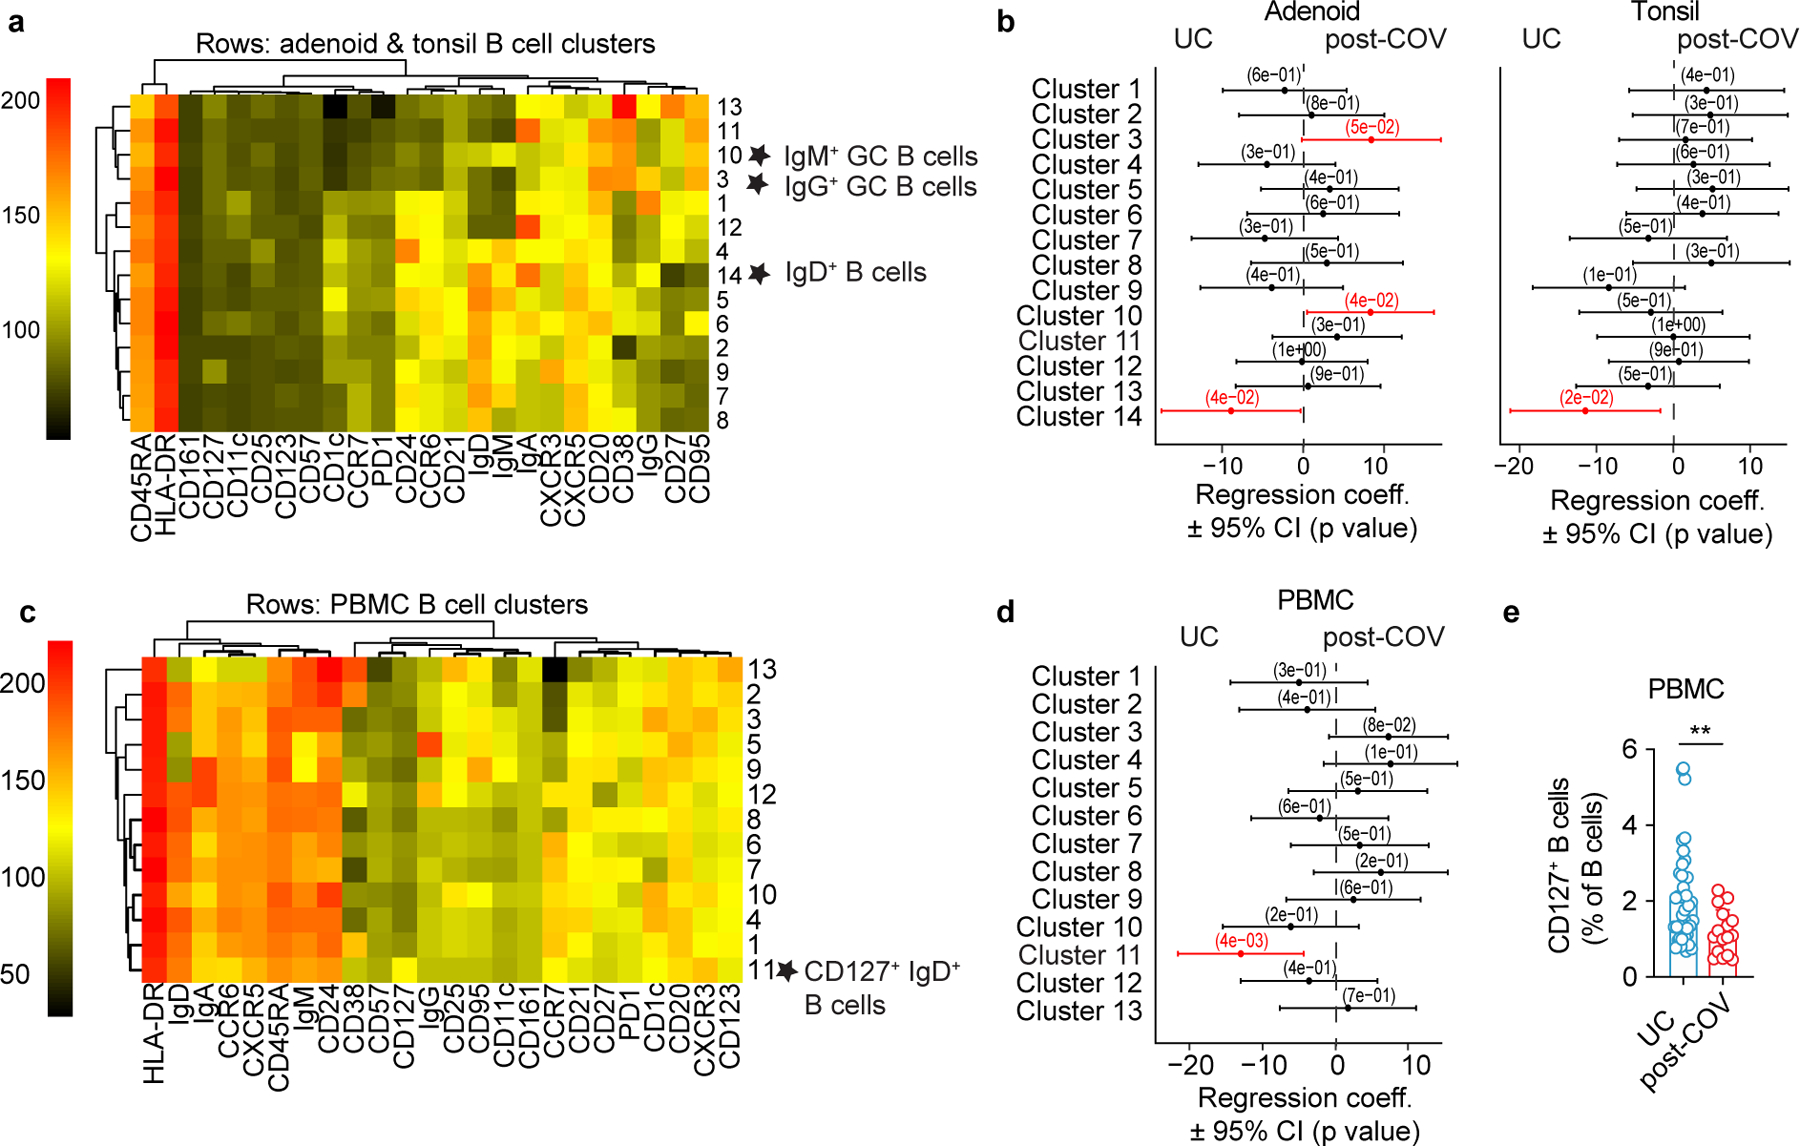
Figure 4. GC B cells are expanded in adenoids after COVID-19.

a- d. Unsupervised clustering of CD19+ B cells from adenoids and tonsils (a) and PBMCs (c) according to flow cytometric surface markers. Quantification of the effect of prior SARS-CoV-2 infection on CD19+ B cell clusters in adenoids and tonsils (b) and PBMCs (d) showing regression coefficients ± 95% confidence intervals (CI) and p values, estimated with a linear model controlling for age and sex. Significantly different clusters (p<0.05) between post-COV and UC groups are indicated with a star or highlighted in red. Adenoids: post-COV n=11, UC n=33; tonsils: post-COV n=15, UC n=42; PBMC: post-COV n=14, UC n=36. e. Frequency of CD127+ B cells in post-COV (n=16) and UC (n=41) PBMCs, p=0.006. Significance calculated with two-sided Mann-Whitney U test. Each symbol represents one donor. Means ± S.D. are displayed. **p<0.01.
