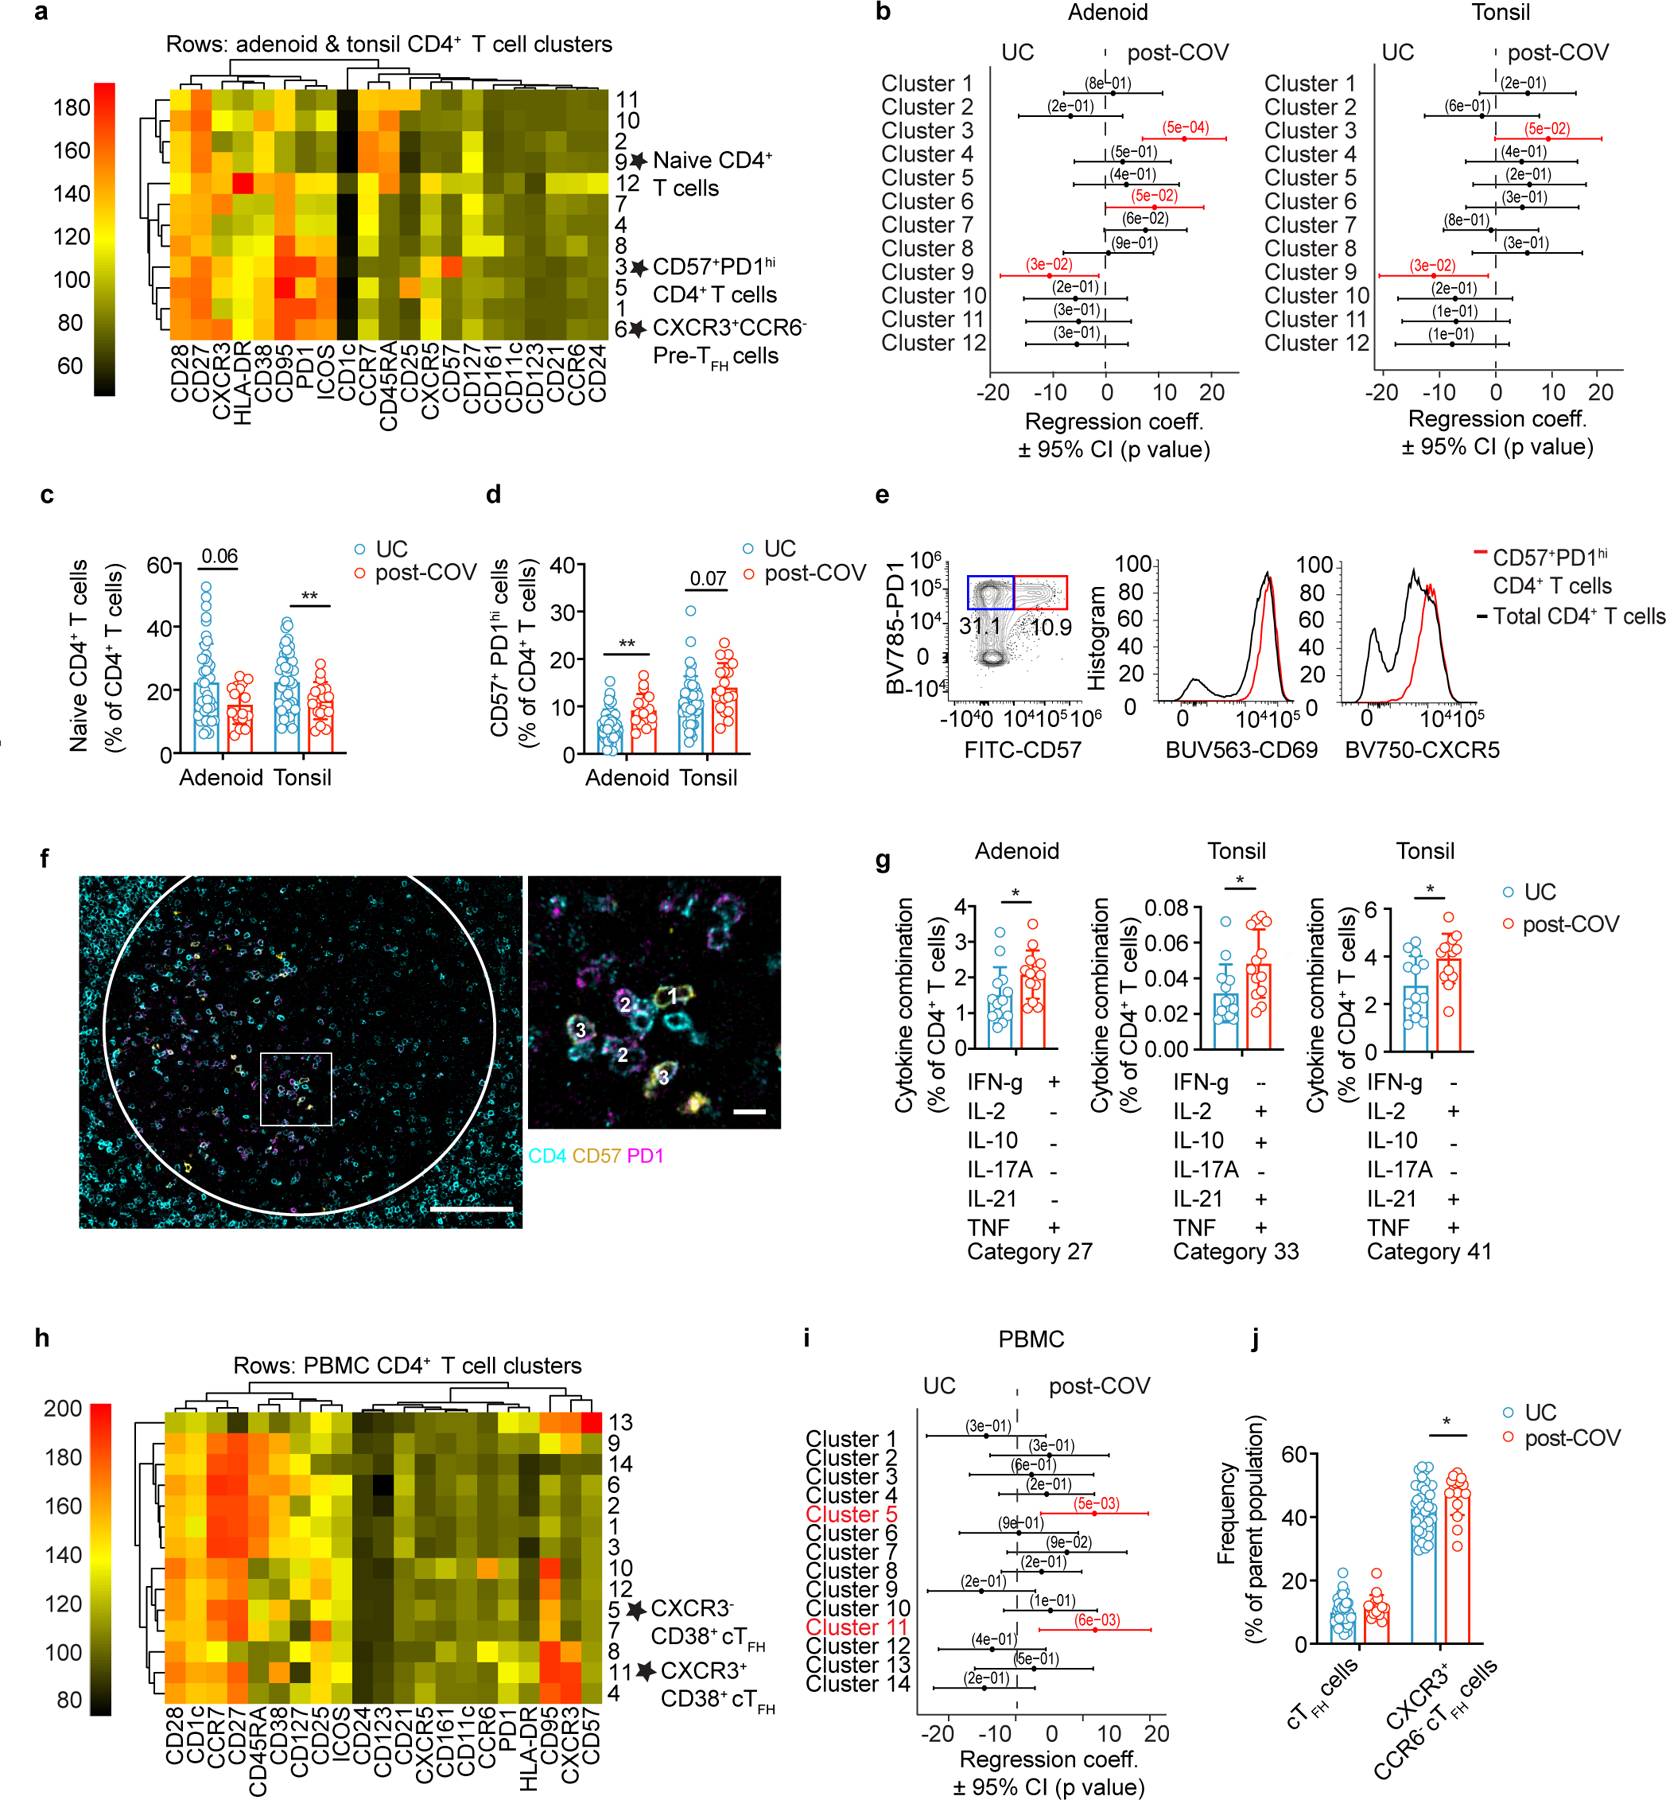
Figure 5. CD4+ TFH cells are expanded post-COVID-19.

a, b. Unsupervised clustering of CD4+ T cells from adenoids and tonsils according to flow cytometric surface markers (a). Quantification of the effect of prior SARS-CoV-2 infection on CD4+ T cell clusters showing regression coefficients ± 95% confidence intervals (CI) and p values, estimated with a linear model controlling for age and sex (b). Significantly different clusters (p<0.05) between post-COV and UC groups are indicated with a star or highlighted in red. Adenoids: post-COV n=12, UC n=38; tonsils: post-COV n=15, UC n=43. c, d. Frequencies of manually-gated CD45RA+CCR7+ naïve CD4+ T cells (p=0.022 for tonsils) (c) and CD57+PD-1hi CD4+ T cells (p=0.001 for adenoid) (d) in post-COV and UC adenoids and tonsils (adenoids post-COV n=17, UC n=42; tonsils post-COV n=18, UC n=46). e. Plots of CD69 and CXCR5 expression on CD57+PD-1hi CD4+ T cells and total CD4+ T cells from one tonsil, representative of tonsils and adenoids from 26 donors. f. Image of post-COV adenoid showing CD57+PD-1hi CD4+ T cells in one GC, representative of tonsils and adenoids from 6 donors. Magnification of square inset shown on the right. CD4 in cyan, CD57 in yellow, and PD-1 in magenta. GC boundaries defined using Ki-67 (see Figure 1h). 1:CD4+CD57+, 2:CD4+PD-1+, 3:CD4+CD57+PD-1+ cells. Scale bars 100μm (left) and 10μm (right). g. Cytokine combinations (IFN-γ, IL-2, IL-10, IL-17A, IL-21 and TNF, as analyzed by SPICE) produced by tonsillar or adenoid CD4+ T cells from post-COV (n=13) and UC (n=13) donors following PMA and ionomycin stimulation (category 27: p=0.04, 33: p=0.01, 41: p=0.03). h,i. Unsupervised clustering of CD4+ T cells from PBMC (h) and quantification of the effect of prior SARS-CoV-2 infection (i) as described in a, b (post-COV n=13, UC n=34). j. Frequencies of CD45RA−CXCR5+PD-1+ circulating TFH (cTFH) and CXCR3+CCR6− cTFH cells in post-COV (n=16) and UC (n=41) PBMCs, p=0.032 for CXCR3+CCR6− cTFH cells. Sample list for panels a-d and h-j in Supplementary Table 2 and for panel g in Supplementary Table 11. Each symbol represents one donor. Means ± S.D. displayed in bar plots. Significance calculated with two-sided Mann-Whitney U test. *p<0.05, **p<0.01.
