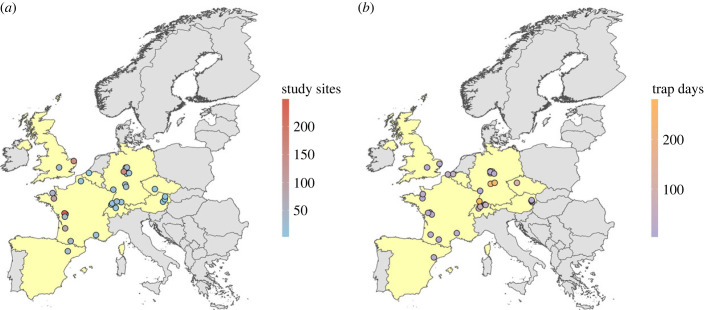
Figure 1.
Map of European countries from which datasets were used for the analyses (yellow coloration). Coloration of the points indicates the number of study sites available in each dataset as a measure of replication (a) and the sampling duration covered in each dataset, i.e. the total number of days a single pitfall trap was active (trap days) as a measure of sampling effort (b). Points jittered by 0.5° to reduce overlay. For more information on the datasets, see electronic supplementary material, table S2.

