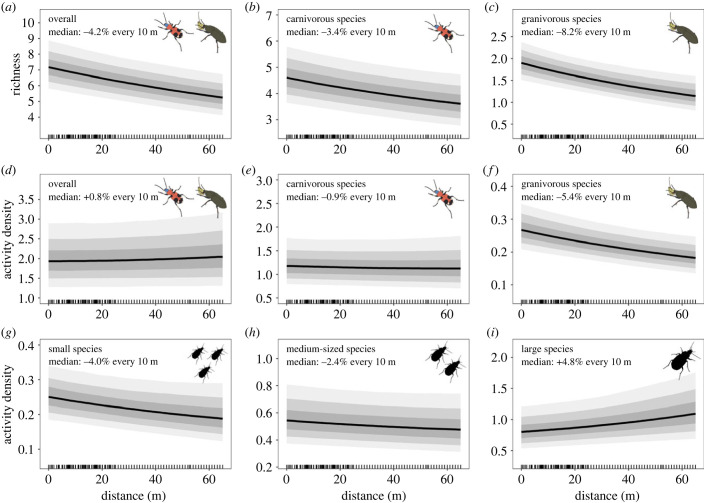
Figure 2.
Overall marginal predictions for (a) overall carabid richness, (b) richness of carnivorous species, (c) richness of granivorous species, (d) overall activity density, (e) activity density of carnivorous species, (f) activity density of granivorous species, (g) activity density of small carabids (less than 6 mm body size), (h) activity density of medium-sized carabids (greater than 6 mm but less than 10 mm body size) and (i) activity density of large carabids (greater than 10 mm body size) across the within-field distance gradient. Response curves depict posterior predictions with 50% (dark), 80% (medium) and 95% (light) credible intervals (CI), back-transformed from the log-link scale to response scale. The rug indicates distances for which data points were available, predictions are limited to the distances covered by the available data (not all data used in the models is shown; distance was clipped at 65 m for visualization as a majority of the data was available up to this distance). For statistics and values, see electronic supplementary material, tables S8 and S9.

