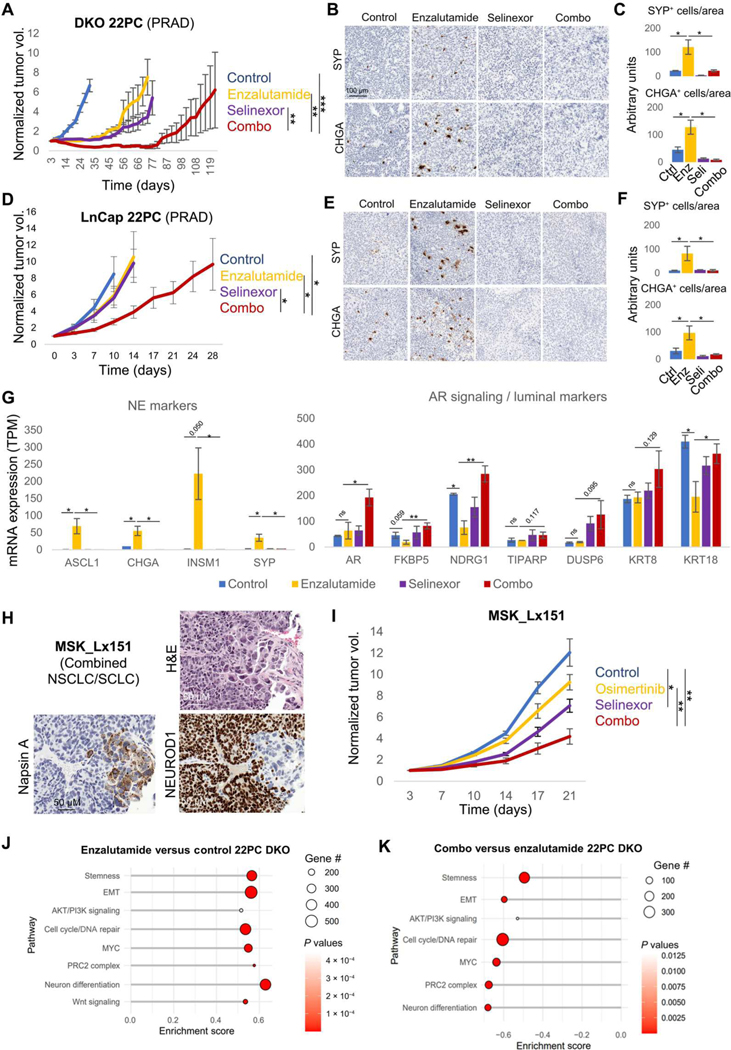
Fig. 4. Exportin 1 inhibition interferes with NE transformation.
In vivo treatment of cell line xenografts for TP53/RB1 DKO 22PC (A) and LnCap/AR (B) PRAD cells with enzalutamide, selinexor, or their combination. Five to 10 female (22PC) or male (LnCap/AR) 6-week-old athymic nude mice were subcutaneously engrafted per treatment arm and grown until tumors reached 100 to 150 mm3. At that point, mice were randomized into groups and treated with either vehicle (n = 7 for 22PC and n = 4 for LnCap/AR), selinexor (10 mg/kg, p.o., QDx3, n = 7 for 22PC and n = 4 for LnCap/AR), enzalutamide (10 mg/kg, p.o., QDx5, n = 7 for 22PC and n = 5 for LnCap/AR), or the combinations of enzalutamide + selinexor at the previously mentioned doses (n = 9 for 22PC and n = 5 for LnCap/AR). Mice weights and tumor volumes were measured twice a week, and mice were euthanized when tumors reached a humane end point (volume, 1000 mm3). Tumor volumes are shown as normalized volume in arbitrary units (au). Each tumor was normalized to its volume at day 0 of treatment. Representative IHC images for synaptophysin (SYP) and chromogranin A (CHGA) staining in DKO 22PC (C) and LnCap/AR (D) tumors. Quantification of SYP- or CHGA-positive cells, normalized to tissue area, in immunohistochemical tissue stains in DKO 22PC (n = 6, 5, 4, and 4 tumors for control, selinexor-, enzalutamide, and combo-treated arms, respectively) (E) and LnCap/AR (n = 5, 5, 6, and 6 randomly selected tissue pieces for control, selinexor-, enzalutamide, and combo-treated arms, respectively) (F) tumors. Positive cells were counted, tissue area (viable tumor area) was estimated using the SketchAndCalc online app (https://sketchandcalc.com/), and positive-stained cells were normalized by estimated area. (G) RNA-seq data from tumors from (A) collected at control arm experimental end point (day 31), showing mRNA expression for genes of interest, involved in NE transformation, divided by treatment arm (n = 4, 3, 3, and 3 tumors for the control, enzalutamide-, selinexor-, and combo-treated tumors). mRNA expression values are shown as TPM. (H) H&E and IHC staining for markers of interest for the EGFR-mutant combined NSCLC/SCLC PDX tumor MSK_Lx151. (I) In vivo treatment of the MSK_Lx151 PDX with vehicle (n = 5), osimertinib (n = 5), selinexor (n = 5), or their combination (n = 5). Five to 10 female 6-week-old NOD.Cg-Prkdc<scid> Il2rg<tm1Wjl>/SzJ (NSG) mice were subcutaneously engrafted per treatment arm and grown until tumors reached 100 to 150 mm3. At that point, mice were randomized into groups and treated with either vehicle, selinexor (10 mg/kg, p.o. QDx3), enzalutamide (10 mg/kg, p.o. QDx5), osimertinib (25 mg/kg, p.o. QDx5), or the combination of osimertinib + selinexor at the previously mentioned doses. Mice weights and tumor volumes were measured twice a week, and mice were euthanized when tumors reached a humane end point (volume, 1000 mm3). Tumor volumes are shown as normalized volume in arbitrary units (au). Each tumor was normalized to its volume at day 0 of treatment. Pathway enrichment analysis on DEGs from enzalutamide versus control (J) and combination versus enzalutamide (K) conditions in the transcriptomic data from TP53/RB1 DKO 22PC xenografts treated in vivo and collected at control arm experimental end point (day 31). Categorized pathways of interest, previously involved in NE transformation (3, 4), are shown. For (A), (C), (D), and (E), P values were calculated using the Student’s t test (unpaired, heterogeneous variances, and two-tailed). *P < 0.05, **P < 0.01, and ***P < 0.001.

