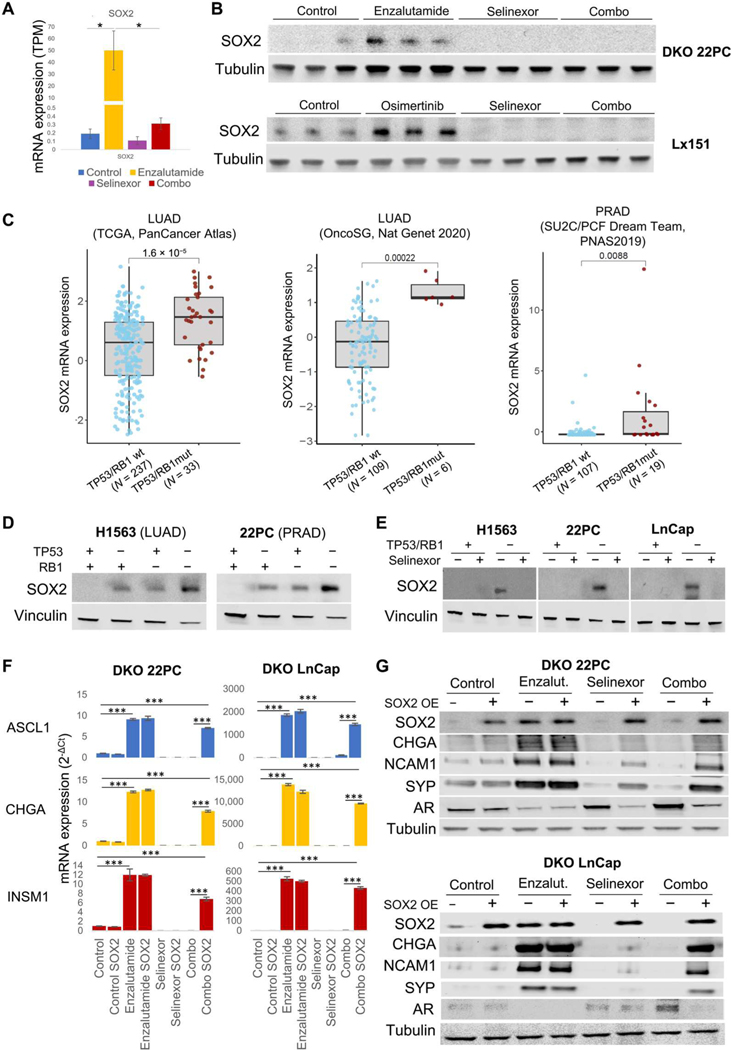
Fig. 5. Exportin 1 inhibition down-regulates SOX2 expression, hindering the acquisition of NE features.
(A) SOX2 mRNA expression in tumors divided by treatment condition. mRNA expression values are shown as TPM (n = 4, 3, 3, and 3 tumors for the control, enzalutamide-, selinexor-, and combo-treated tumors, respectively). (B) Western blot showing SOX2 protein expression of TP53/RB1 DKO 22PC and Lx151 models treated in vivo (n = 3 per treatment condition). Five to 10 female 6-week-old NOD.Cg-Prkdc<scid> Il2rg<tm1Wjl>/SzJ (NSG) mice (Lx151) or female 6-week-old athymic nude mice (22PC xenografts) were subcutaneously engrafted per treatment arm and grown until tumors reached 100 to 150 mm3. At that point, mice were randomized into groups and treated with either vehicle (n = 7 for 22PC and n = 5 for Lx151) selinexor (10 mg/kg, p.o., QDx3, n = 7 for 22PC, and n = 5 for Lx151), enzalutamide (for 22PC, 10 mg/kg, p.o., QDx5, n = 7), osimertinib (for Lx151, 25 mg/kg, p.o., QDx5, n = 5), or the combinations of enzalutamide + selinexor (22PC, n = 9) or osimertinib + selinexor (Lx151, n = 5) at the previously mentioned doses. Mice weights and tumor volumes were measured twice a week, and mice were euthanized when tumors reached a humane end point (volume, 1000 mm3). (C) SOX2 mRNA expression in LUAD clinical specimens, categorized by their TP53/RB1 status. P values are shown. Data obtained from LUAD TCGA (PanCancer, n = 237 wt and 33 mutated), LUAD OncoSG (OncoSG, Nat Genetics 2020, n = 109 wt and mutated), and PRAD TCGA (PanCancer, n = 107 wt and 19 mutated) (15, 16). See also fig. S3. (D) Western blot showing SOX2 protein abundance in isogenic control and TP53-and/or RB1-inactivated H1563 (LUAD) and 22PC (PRAD) cell lines. (E) SOX2 protein abundance in control and TP53/RB1-inactivated H1563 (LUAD), 22PC, and LnCap/AR (PRAD) cell lines treated with selinexor (5 nM) for 4 days. ASCL1, CHGA, and INSM1 mRNA expression (F) and SOX2, CHGA, NCAM1, SYP, and AR protein abundance (G) in DKO 22PC cells treated with enzalutamide (150 nM), selinexor (5 nM), or their combination for 4 days. For Western blots and mRNA plots, representative images are shown. P values were calculated using the Student’s t test (unpaired, heterogeneous variances, and two-tailed). *P < 0.05, and ***P < 0.001.

